<center>研一下-学术英语阅读与写作-外国语学院-孙玉超</center>
—————————————
2022-02-24 (第一节课)
《学术英语阅读与写作》
TEL& WeChat: 18763005008
石大云课堂:这周专题的测试;
八次课,论文每一部分的专题与讲座,学科专业差异很大的;
面对面建群,实名制
请假,微信群里说一说就行;
课程要求
最终成绩,没有期末考试
- 60~70,七次云课堂平台作业;
- 15~20,文献综述性论文;目前这个方向的不足;
- 15~20,考勤与课堂表现;最后不会很差;
最后成绩不会低;
Thesis Title
学术论文
硕博论文
选题很重要
成功的一半
Functions (Purposes) of a Title
essence
retrieve
content
interest
tone
keywords
Principles of Title Selection
论文,基金,课题
Value,学术价值,经济价值-应用价值
Scientific,语言,专业性,
Innovative,亮点,
Feasibility, 可行性,
Methods for Choosing a Title
Title ➡ Abstract ➡ Conclusion, limitation
professor
academic conferences and lectures
problems
books
interest
literature review
尽量靠自己,少依赖别人,别最后老师给指方向;
Ways to Narrow Down Titles
论文的题目更具体,项目的题目更大;
定个小目标,将来不会后悔的
Structure & Form of Title
Nominal phrase,
Conpounding title,
- colon type, a two-type part
Full sentence title,
- advantage
- disadvantage, assertive
Title with questions,
- 知网-很知名的期刊-期刊目录
Formats for Title
Capitalization
- 首字母大写;
- 大于等于5个字母的介词、连词,可能大写;
- 全大写,报单;
- conpounding title 冒号后的首字母大写;
题目带有’研究,试验,初探,效果,影响‘;
…
Do’s and Don’ts
Do’s
- relevant, informative
- 和文章内容近似
- clear and precise
- attention
Don’ts
- jargon,行话
- …
Length of Title
冠词
- 一般加 a,the 一般不加;
- a, an;
介词
- of(at in), from, to,in (of), between(during)
A string of noun
测试成绩1:title
4分
B (我选了C)
C
C
A
ABCD
AC (我选了ABC)
decreased
reached (我写了increased to)
an (我写了the)
a (我写了an)
2022-03-03
Abstarct
lecture objectives
overview
硕博论文摘要和期刊论文摘要
definition
condensed,
abbreviated,
concise,
America National Standards Insitute, quickly,
keywords
types
描述型摘要
信息型摘要
quantitative, specific
topic, approach, conclusion
信息-描述型摘要
backgroud, topic, approach, conclusion, significance
structured abstract
review (评审)
peer review (同行盲审)
how long
structure and elements
测试成绩2:abstract
6分
觉得题目怎么说呢,没多大价值,全是死记硬背的东西,根本不像是在学英语~~幸好还是得了6分😎~
最后能得到70分就可以了,快吐了🤮
不推荐上~~
Introduction
empirical research:实证研究
P M
M
P
P
M
P
M
情态动词确定性
can,will,would,should, may, might
确定性从强到弱~~
信息流:assertion, zone, method, gap, species
测试成绩3:introduction
交流群给的答案:D C B A C B ABC ABCD ✓ ✓

Method
other name
methodology,
experiments,
structure
测试成绩4:method
21-新能源-(1344496449) 2022/3/18 19:56:12
1-5AACBC
6ABCD
7BCD
8-10√√x

Result
element
location+indicative summary
练习
- As (shown)
aton (page)- in (Chapter)
- in (diagram)
- from (data)
onin (chart)- in/from (Table)
highlighting statement
- general to specific~
findings+interpretation+implication
- 不好的结果,误差,显著统计性的确实,(表达要隐晦)
练习element
①② ①:location+indicative summary
③ ②③:highlighting statement
④:interpretation+implication
Data vs. Result
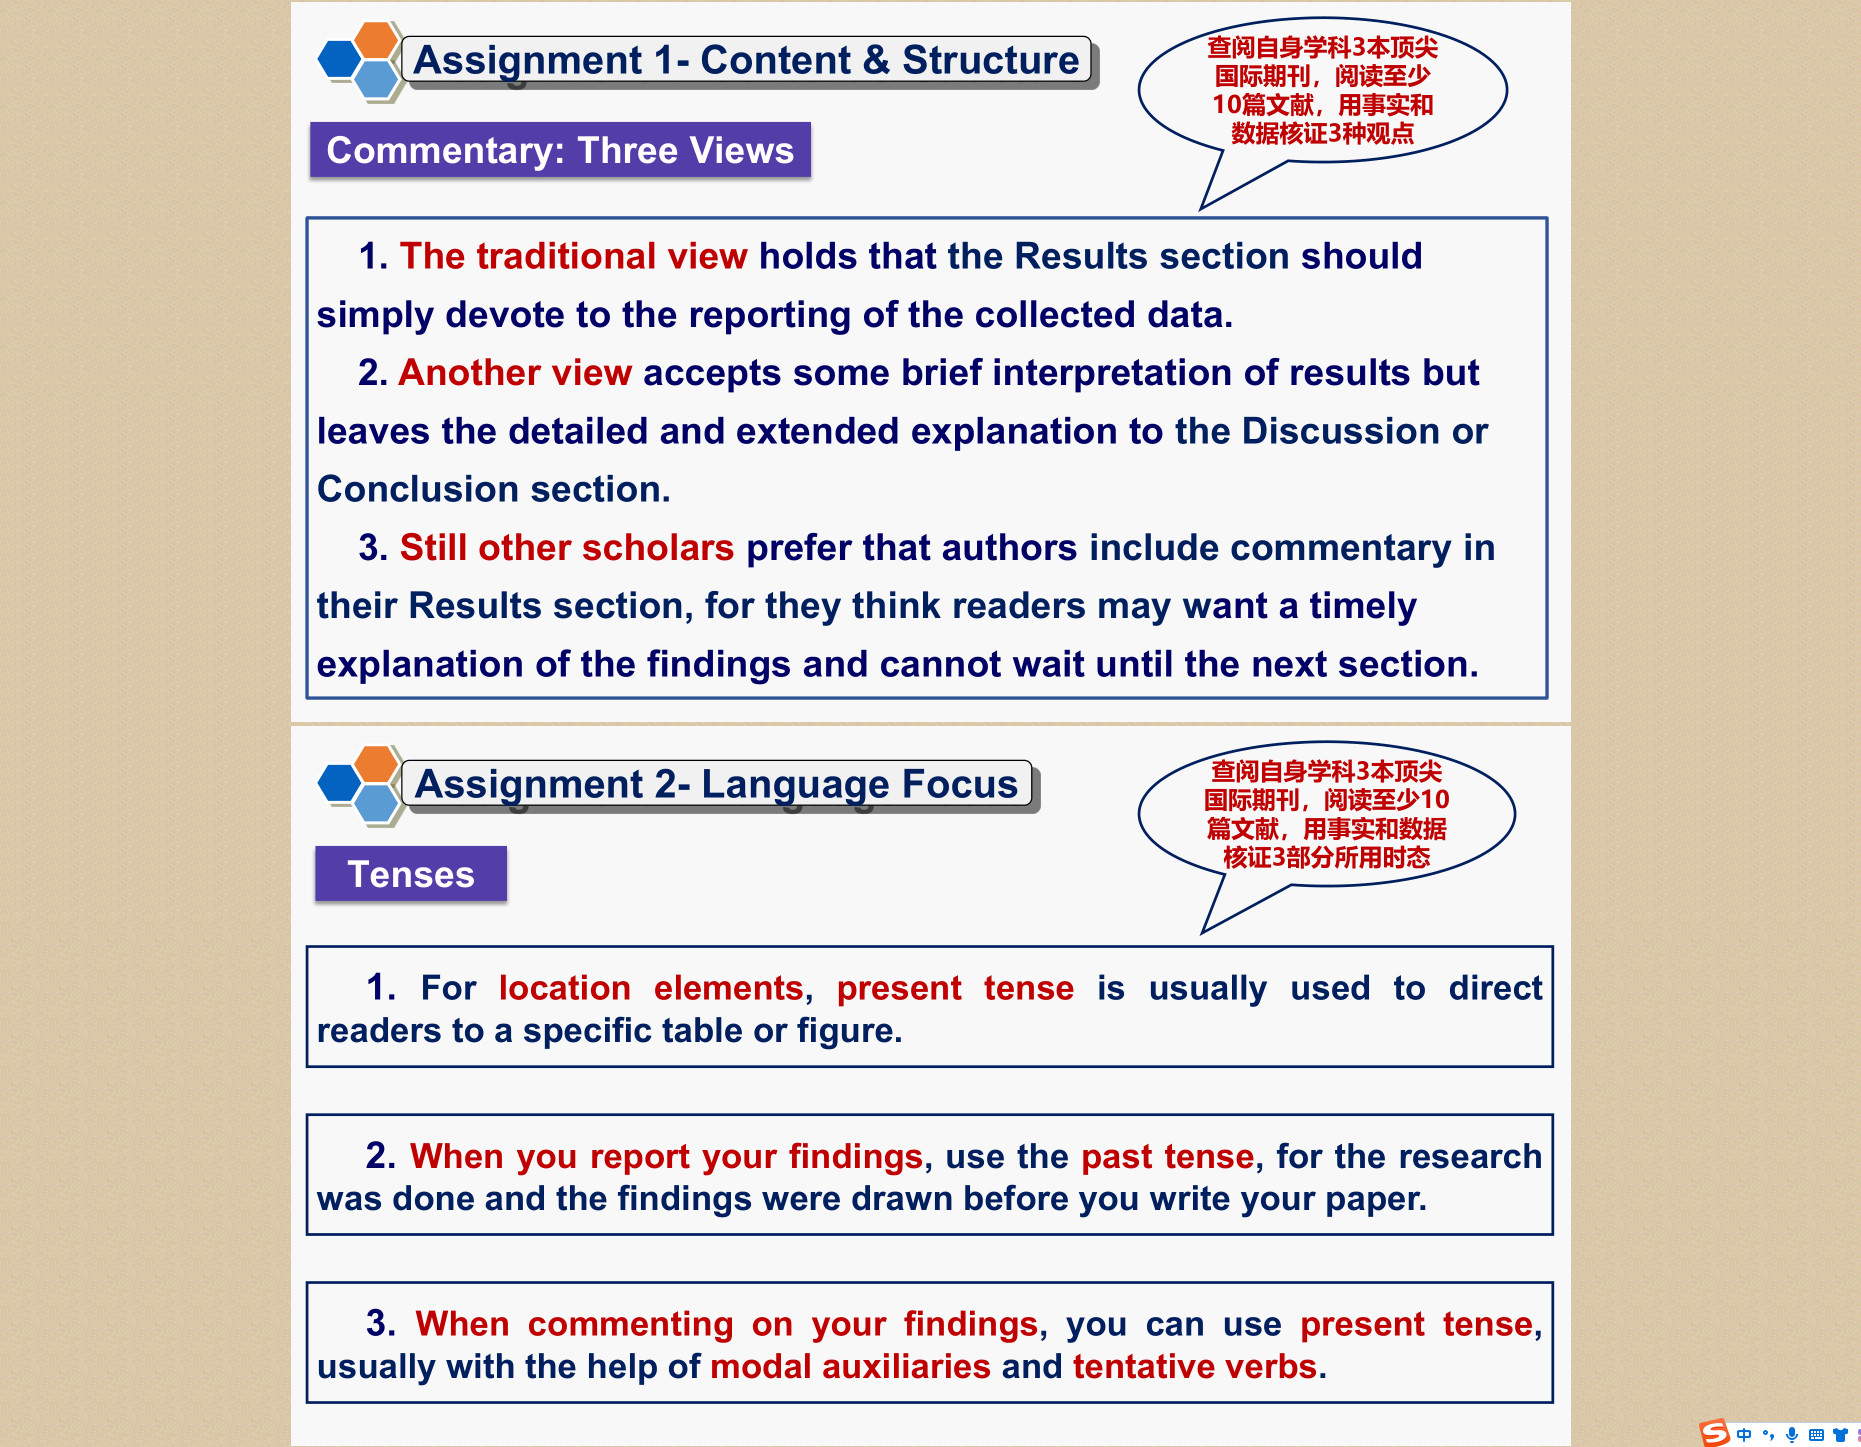
Commentary : Three View
- 传统View,comment不在result评论;
- 另一种View,comment先在result里简要说明,然后在discussion/conclusion详细说明;
- 再另外一种View,comment主要在result讨论;
Commentary:Two patterns of Organizing
Alternating Patetrn 交替,
Result 1+Comment1, Result 2+Comment2, Result 3+Comment3,
Sequential Patetrn 序列,
Result 1, Result 2, Result 3, Comment,
shared one comment,
练习Commentary:Two patterns of Organizing
交替式,
序列式,
length of claim
练习:Strong,weak,neutral statement
S (N), contributed to
S, caused
W, may have contributed to
N (W), was one of the cause of
W, was probably a major cause of
W, might have been a factor in
练习:weaker claim
suggest,
assumes,
indicates,
impies,
demostrates,
prove,
show,
indicative & informative statement
As-clause
as shown in
as can be seen from
annouce , confirm, ~
Tense
一般现在时,for location,
一般过去时,findings,
现在时+情态动词,comment,
总结
- text, figure, table
- 被动主要,主动也可用
- 过去时态
- 句式多样性
- 不能跳过不好的结果
- …
- …
- …
- …
测试成绩5:result
@ZDX(1431713059) 2022/3/27 21:51:35
ABBAA AB ABD × × ×学术阅读与写作答案

作业:3期刊+10文章,commentary,Tense


endnote~~
期刊1:Remote Sensing,
Nawin Raj et al.,澳大利亚
3 Results and Discussion
The Taylor diagram (see Figure 12) shows the statistical summary of how the observed values match with the forecasting values. Figure 12 shows the comparison of the models in terms of Pearson’s correlation, RMSE and standard deviation. The illustration shows the objective model (red dot) outperforming all other benchmark models in terms of these important performance measuring metrics.
期刊2:Ocean Engineering,
Yehia Miky et al.,沙特
4 Results and discussion
As shown in Tables 4–6, the time head affects the accuracy of the proposed models. In RNN, with an increase in time head, the accuracy of the model decreases in the designing stage. However, in the validation stage, because of the timing error between input and output variables, in the 1, 3, and 6 h of time head, the accuracy of RNN is acceptable. The accuracy in 3 h of time head is high due to the small effect of time error. In NNARX, the model overcomes the timing error in the designing and validation stages. The accuracy of the proposed model is high up to a one-day time head in the designing stage and up to 12 h in the validation stage. In RNNARX, the accuracy is improved in both designing and validation stages up to 5and 4-days’ time head, respectively. It means that the RNNARX model can be used to remove the prediction lag in the time-series prediction of Hs. Thus, integration and sequential learning of the neural network provide more acceptable results for Hs prediction at high lead times. The sequential system improved the performance of RNN and NNARX models for the time-series prediction of Hs. The comparison results of RNN, NNARX, and RNNARX show that the performance of NNARX is better than RNNARX in terms of percentage of model errors up to 6 h of lead times for Hs prediction. For more than 6 h of lead times, the RNNARX achieves a high performance up to 5 days’ lead times. Therefore, to decrease the complexity of calculation and time-consuming, the NNARX can be used to estimate the Hs in the Red Sea for the 6 h of lead times; for more than 6 h of time head, the RNNARX is better to use.
Christoph J¨orges et al., 德国
3 Results and discussion
Fig. 9 shows the differences between the measured and modeled values for the 12 h-ahead prediction excluding bathymetric data. The P-LSTM and LSTM showed the narrowest line here as well. The FFNN showed a higher variability for extreme values than the RF and a similar scatter plot to the SVR. Differences between the several models were most significant for this forecasting period.
期刊3:Renewable Energy
Weinan Huang et al.,中国
5 Discussion
To assess the uncertainty of the significant wave height simulations, a stochastic approach presented by Montanari and Brath [95] was applied to calculate the 95% confidence interval, as shown in Figs. 9 e11. For each lead time, the confidence bands of the hybrid model are narrower than those of the stand-alone LSTM model. This can be caused by the higher magnitude of the single LSTM model errors.
期刊4:Ocean Dynamics
The Ensemble Kalman Filter: theoretical formulation and practical implementation,Geir Evensen,挪威,没有results,没有图表,主要是算法公式推导和代码;
期刊5:Ocean Modelling
Jennifer Waters,英国
5 Results
Fig. 11 shows spectra from the Lundy buoy and WW3 runs dur-ing the peak of the storm (12:00 13/02/05). The impact of the turning winds is visible in all spectra. There is old windsea travelling towards the East and new windsea travelling towards the South. In the buoy spectra there is a smooth transition between the new and old windsea. In the original WW3 spectrum the waves appear to have turned too fast and there is too much energy travelling towards the south. There is an improvement in the MP assimilation case with less energy travelling towards the South, but the best results are seen in the PIP assimilation case where the distribution of the energy in frequency and direction of the turning windsea best replicates that of the buoy spectra. This supports the suggestion that the PIP assimilation can provide better results in cases of turning winds.
期刊6:Coastal Engineering
An application of a machine learning algorithm to determine and describe error patterns within wave model output, Ashley Ellenson et al.,美国
3 Results
4 Discussion
For an example of how an input feature can discriminate a region of high target value, see Fig. 11, where wind magnitudes > 15m=s delineate a region of greater negative bias in the training data. A possible avenue of future work would be to identify other input variables (beyond those used in this study) that would be more informative for summer data.
2022-04-05 英语大作业
《学术英语阅读与写作》的期末大作业已经在云课堂平台的课程作业里面发布,截止日期为5月1号,及时完成提交。
2022-04-28 开干开干,( •̀ ω •́ )✧

题目
全球业务化海洋预报系统进展
Progress of Global Operational Ocean Forecasting Systems
摘要
全球业务化海洋预报系统可为海洋减灾防灾、航行安全、生态系统保护和搜救等提供预报服务。海面风是驱动海浪的源,因此提供海浪业务预报服务的国家/机构一般与数值天气预报结合在一起开展。
Abstract:The global operational ocean forecasting system is a comprehensive application with ocean numerical models as the key,ocean observation as the basis,and supercomputer comprehensive application capabilities as the tool,providing a full range of forecast services for ocean disaster reduction and prevention, navigation safety,ecosystem protection,search and rescue,etc. It briefly introduces the countries/organizations implementing marine operational forecasting services and their atmospheric forecasting systems. Sea surface wind is the source of driving waves,so wave forecasting is generally carried out in conjunction with the atmosphere. The parameter configurations of the global ocean wave forecasting system constructed based on WW3 and WAM ocean wave numerical models is introduced. It focuses on the composition and parameter configuration of the global ocean circulation forecasting system developed based on the HYCOM,NEMO and MOM ocean models. An overview of the sea ice operational forecasting system based on the CICE and LIM sea ice models and coupled with the ocean circulation forecast system. Finally,the conclusions and development directions of the global operational ocean forecasting system are summarized
1 引言
全球业务化海洋预报系统以海洋动力数值模式作为动力框架,将近实时高质量的观测场通过资料同化输入到模式中,实现对全球范围多时空尺度的海洋状况的预报,并对产品质量不断进行监测以保证预报服务的质量[1]。
海洋预报系统是业务海洋学的基础[2] 。众多国家或机构开发了全球和区域海洋预报系统。刘春霞等[3]通过对当前业务运行模式系统的调研,发现无论是全球模式还是区域模式,海洋环流模式和海浪模式的分辨率都越来越高。韩鹏等[4] 回顾近年来国外主要海洋预报业务机构全球海洋环流预报技术的发展现状,特别是最近5~10年来在全球海洋动力数值预报模式和多源资料同化技术方面的主要进展。刘娜等[1] 介绍和回顾全球海洋数据同化实验 (Global Ocean Data Assimilation Experiment,GODAE)OceanView 所涵盖的全球海洋预报系统的发展历程和现状,并对全球海洋预报未来发展的难点与问题给予展望。王辉等[5] 介绍了国家海洋环境预报中心 (National Marine Environmental Forecasting Center, NMEFC)在国内首次构建的全球—大洋—近海3级 嵌套的全球业务化海洋学预报系统体系,实现了全球海域范围内从百公里级到公里级空间分辨率的 一体化预报业务全覆盖。 Tonani 等[6] 概述了 GODAE OceanView中代表性全球和区域海洋预报系统的特征和演变。
全球业务海洋预报系统的一个重要应用是满足军事需求[7] 。朱亚平等[8] 回顾了过去几十年美国海军海洋学的发展历程,介绍了海军海洋学业务保障体系,对其科研机构和研发机制以及业务系统的 发展特点进行了总结。徐洋等[9] 对美国海军海洋预 报系统的发展历程、成果及其现状进行阐述。
海洋环境业务预报系统的开发不仅与海洋模式、海洋观测、数据同化技术有关,而且对高性能计算技术的要求也非常高。因此,能够开展全球尺度海洋环境预报不仅是国家科学和技术实力的综合展示,更是为我国实施海洋强国战略,维护国家海洋权益、保障涉海安全生产、应对海上突发事件等提供有力的科技支撑。
2 业务化海洋预报机构
过去几十年,由于对大气物理过程表征、集合预报和模式初始化的显著进步,使得数值天气预报 (Numerical Weather Prediction,NWP)预报技能得到显著提高:每 10 年对 3~10 天的预报技能增加约 1 天[10]。
3 海浪数值预报系统
海浪的预报依赖于 NWP 系统的发展,尤其是 10 m风场的精度。因此,各国气象部门基本上都将 海浪和 NWP 系统作为共同业务运行。目前,对海浪进行数值模拟的模式包括 :海浪模式(Wave Model,WAM),近岸海浪模 拟模式(Simulating WAves Nearshore,SWAN)和 WAVEWATCH III® (WW3)。这些模式的主要相似之处是使用包括源 和汇项的动谱平衡方程,但它们在数值方法和物理过程参数化方面有所不同。WAM围绕一组源项构 建,而 SWAN 和 WW3 具有广泛的源项和用户可选 择的参数化。WAM 和 WW3 最初是作为大尺度模型开发的,而 SWAN专门用于模拟近岸海浪。尽管如此,解决近岸过程新的源项和参数化以及更高级 的数值方法也被引入WAM和WW3。
SSSSSSSSSSSSSSSSSSSSSSSSSSS
4 海洋环流数值预报系统
国际主流全球业务化海洋环流预报系统一般基于混合坐标海洋模式(HYbrid Coordinate Ocean Model,HYCOM)、欧洲海洋核心模式(Nucleus for European Modelling of the Ocean, NEMO)和模块化海洋模式(Modular Ocean Model, MOM)海洋环流模式开发。HYCOM的垂直坐标采用各种方式进行组合,可以将传统的等密度坐标海洋环流模式适用的地理范围扩展到了浅海沿岸海域和海洋的弱分层地区,但又在分层海域中保持了 等密度模式的显著优势,同时在海表附近和浅海沿 岸地区提供了更高的垂直分辨率,从而更好地表示海洋上层海洋物理学。NEMO海洋模型包含3个主要组成部分:海洋(热)动力学模块,海冰(热)动力学模块,以及示踪剂模块。为更好地模拟全球海洋状态,采用允许覆盖整个海洋而没有奇异点的三极网格。MOM 起初主要用于研究海洋气候系统,随着最新版MOM6采用水平C网格构建,可以更加准确模拟全球活跃的中尺度涡。
5 海冰数值预报系统
海冰是地球气候系统不可或缺的一部分。在 近 10 年中,极地海冰的预报取得了显著进步,大多 数海洋环流预报系统中都耦合了海冰模式,能够在 各种时间尺度上对海冰进行预报。海冰预报系统 一般基于 CICE和 LIM开发。
6 展望
经过海洋环境数值预报系统多年的发展,各个预报系统有趋同的趋势。如第三代海浪数值模式 采用相同的源汇参数化方案、数值差分方案等。HYCOM混合垂直坐标的显著优点也越来越多的被其它模式所采用。影响不同预报系统预报精度、准确率的因素包括大气数值模式的输出结果、超级计算机的计算能力、能够同化观测数据的多寡等。为进一步提升海洋环境数值预报系统的预报准确度,提升服务社会的能力,可以以下几个方面取得突破。
- 综合考虑海洋内部(海洋—海浪—海冰)多物理过程,及其与地球系统各圈层(包括大气、陆地和生物)的耦合是提升海洋环境预报能力,实现无缝隙、多要素预报的一个重要方向。
- 使用先进的同化技术,如四维变分同化或集合卡尔曼滤波等技术,尽可能的融合多源观测数据,提升数值预报系统初始场质量,是改进海洋环境短期预报效果的一个重要方向。
- 近年来,人工智能(或深度学习)技术在大气/海洋预报领域广泛应用。深度学习具有从大量的高维时空分布气象海洋数据中提取复杂时空特征的能力,且具备计算效率高、可迁移性强、协同性和灵活性优的特点。如何将传统数值预报和人工智能技术相补充或结合是提升海洋环境业务预报保障能力的一个重要方向。
MyWork:Operational ocean forecasting system
The global operational ocean forecasting system is a comprehensive application with ocean numerical models as the key, ocean observation as the basis, and supercomputer comprehensive application capabilities as the tool, providing a full range of forecast services for ocean disaster reduction and prevention, navigation safety, ecosystem protection, search and rescue, etc.
Ocean forecasting systems are the fundamental of operational oceanography [2] . Numerous countries or institutions have developed global and regional ocean forecasting systems. Liu et al [3] investigated the current operational model systems and found that the resolution of ocean circulation models and wave models are getting higher and higher in both global and regional analyses. Han et al [4] reviewed the current development status of global ocean circulation forecasting by major foreign operational ocean forecasting agencies in recent years, especially the main advances in global numerical ocean dynamics forecasting models and multi-source data assimilation technology during the last 5~10 years. Liu et al [1] introduced the progress of Global Ocean Data Assimilation Experiment (GODAE) OceanView in the global ocean forecasting system, and provided their insights on the future development of global ocean forecasting. Wang Hui et al [5] presented the global operational oceanographic forecasting system of the National Marine Environmental Forecasting Center (NMEFC), which was built for the first time in China with a nested global-ocean-offshore level, achieving full coverage of forecasting operations from 100 km to km spatial resolution in the global sea area. Tonani et al [6] summarized the characteristics and evolution of representative global and regional ocean forecasting system in GODAE OceanView.
An important application of the global operational ocean forecasting system is to meet military needs [7]. Zhu et al [8] reviewed the development process of U.S. naval oceanography in the past decades, described the naval oceanographic operational assurance system, and summarized the development characteristics of its scientific institutions and R&D mechanisms as well as operational systems. Xu et al [9] presented the development history, achievements and its current status of the U.S. Navy ocean forecasting system.
Generally, there are three main types of the global operational ocean forecasting system, namely, wave forecasting system, ocean circulation forecasting system, and sea ice forecasting system.
Forecasting of waves depends on the development of Numerical Weather Prediction (NWP) system, especially the accuracy of 10 m wind fields, resulting that the wave and NWP systems are operated as common business in essentially every national meteorological service. Current waves models for numerical simulation based on dynamic spectral balance equations with source and sink terms involve Wave Model (WAM), Simulating WAves Nearshore (SWAN), and WAVEWATCH III® (WW3), which differ in their numerical approach and the parameterization of physical processes. WAM is constructed with only a set of source terms, while SWAN and WW3 a wide range of source terms and user-selectable parameterizations. Though SWAN is specifically designed to simulate nearshore waves, new source terms and parameterizations for solving nearshore processes as well as more advanced numerical methods are also included in WAM and WW3, which were originally developed as large scale models.
The international mainstream global operational ocean circulation forecasting system is generally developed based on the HYbrid Coordinate Ocean Model (HYCOM), Nucleus for European Modelling of the Ocean (NEMO) and Modular Ocean Model (MOM) ocean circulation models. The vertical coordinates in HYCOM are combined in various ways to extend the geographic applicability of the traditional isodensity coordinate ocean circulation model to shallow coastal waters and weakly stratified areas of the ocean, yet maintaining the significant advantages of the isodensity model in stratified waters, while providing higher vertical resolution near the sea surface and in shallow coastal areas to better represent the upper ocean physics. The NEMO ocean model contains 3 main components: an ocean dynamics module, a sea ice dynamics module, and a tracer module, where a tri-polar grid covering the entire ocean without singularities is utilized to better simulate the global ocean state. Despite the fact that MOM was initially used mainly to investigate the ocean climate system, with the latest version of MOM6 built with a horizontal C-grid, it can more accurately simulate globally active mesoscale eddies.
Sea ice is an integral part of the Earth’s climate system, and there have been significant advances in polar sea ice forecasting in the last decade, particularly the ability to forecast sea ice on various time scales with the coupling of ocean circulation forecasting systems. Sea ice forecasting systems are generally developed based on Community Ice CodE (CICE) and Louvain-la-Neuve (LIM).
After years of development of numerical prediction systems for the marine environment, there is a trend of convergence among the prediction systems. For example, the same source-sink parameterization scheme as well as numerical difference scheme are employed in the third-generation numerical wave models, and the substantial advantages of HYCOM hybrid vertical coordinates are also increasingly adopted by other models. The factors affecting the forecast accuracy and precision of different forecasting systems include the output of atmospheric numerical models, the computing power of supercomputers, and the number of observations that can be assimilated. In order to further improve the forecast accuracy of the numerical marine environmental forecasting system and enhance the ability to serve the society, breakthroughs can be made in the following aspects:
- The integrated consideration of multi-physical processes within the ocean (ocean-wave-sea ice) and its coupling with all circles of the Earth system (including atmosphere, land and biology) is an important direction to promote the capability of marine environmental forecasting and achieve seamless and multi-element forecasting.
- Using advanced assimilation techniques such as four-dimensional variational assimilation or ensemble Kalman filtering, fusing more multi-source observation data as much as possible, and improving the quality of the initial field are the core guidelines for improving the effectiveness of short-term forecasting of the marine environment.
- In recent years, artificial intelligence (or deep learning) techniques have been widely invoked in the field of atmospheric/ocean forecasting, and their combination with traditional numerical forecasting provides more possibilities to guarantee the operational forecasting capability of the marine environment.
参考文献
…
百度网盘保存的docx和pdf
链接:https://pan.baidu.com/s/1v6L6tc_pbmEy7jhaTru69g?pwd=1moi
数字石大上传docx和pdf
OK,可多次提交~
SSSSSSSSSSSSSSSSSSSSSSSSSSSSSSSSSSS
2022-04-06 英语近义词典 moby
@所有人 最庞大的英语近义词典“moby thesaurus”,史上最强的英语近义词词典,1996年建成并公开,有3万词条,250万近义词,平均每词有83个近义词,例如big有283个近义词,charming有108个近义词,important有166个近义词
http://www.moby-thesaurus.org/
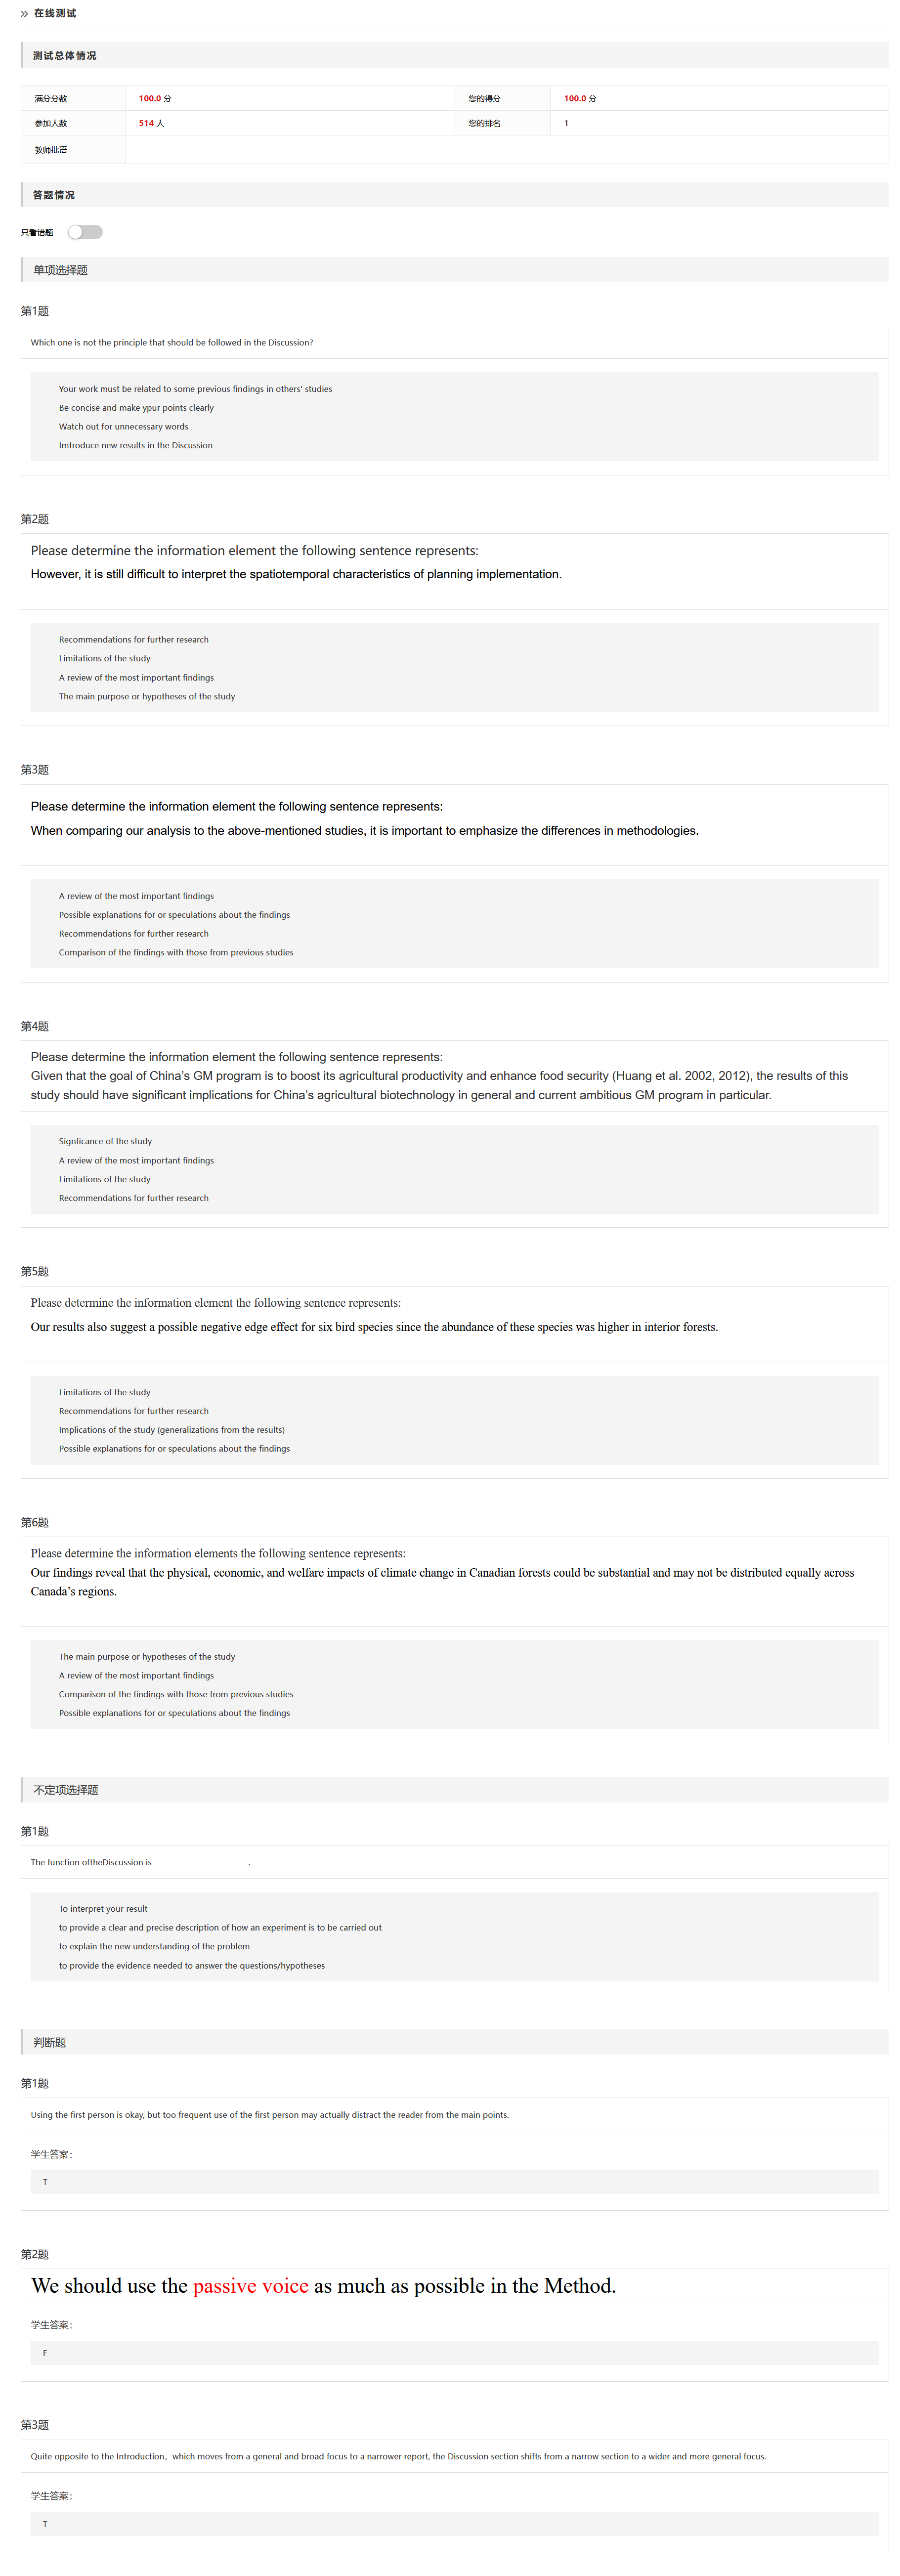
测试成绩6:discussion
dbdacb ac 对 错 对

SSSSSSSSSSSSSSSSSSSSSSSSSSSSSSSSSSSSSSSSSSSSSS
Discussion & Condlusion
definition
what is discussion
what is conclusion
- 总结概括
- 评价:研究意义、价值,
- 推荐
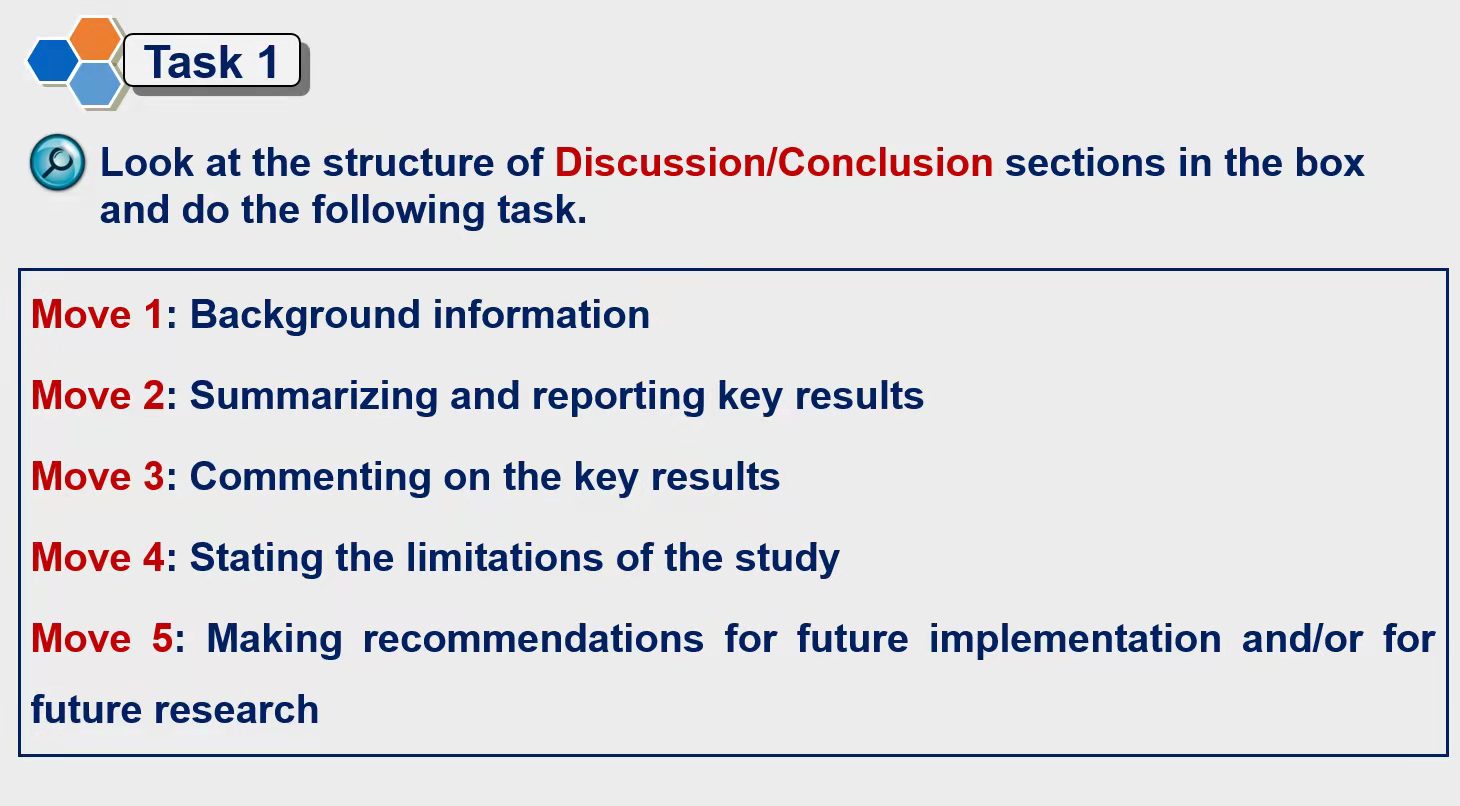
Content & Structure
7个要素
- 复述
- 评述
- 比较
- 。。。
- 局限性
- 启示和意义
- 建议
5个步骤
…


4
2
1
2
5
全错
1-B
2-A
3-D
4-C
5-E
2
1
4
3
5
SSSSSSSSSSSSSSS
测试成绩7:conclusion
庸医(1720488013) 14:59:02


SSSSSSSSSSSSS


