<center>研一下-海表面风和海浪多源数据融合实况</center>
文档托管
WPS云文档:【MasterG1S2_海表面风和海浪高多源数据融合实况】

2022-03-05 wjc老师反馈
什么是 实况:
- 不是预报
- QT:是对当前时刻的前几个小时的观测,进行融合?;
work:
- 老师发的资料,
- 资料1.docx
- 其他项目的初设——请避免重复——暂不用参考本文档的格式.docx
- 洋面风海浪等模块-wjc20180616.docx
- 风场融合实施方案word03.doc
- RemoteSensors遥感仪器综述.doc
- 主要科研机构的做法,
- 最新的文献,
↑ 上面的work,并不是具体去做什么,而是以 find_idea 的形式去推进,以问题为驱动~
QT:什么是数据融合?
Data fusion is the process of integrating multiple data sources to produce more consistent, accurate, and useful information than that provided by any individual data source.
Data fusion processes are often categorized as low, intermediate, or high, depending on the processing stage at which fusion takes place[1] .Low-level data fusion combines several sources of raw data to produce new raw data. The expectation is that fused data is more informative and synthetic than the original inputs.
For example, sensor fusion is also known as (multi-sensor) data fusion and is a subset of information fusion.
The concept of data fusion has origins in the evolved capacity of humans and animals to incorporate information from multiple senses to improve their ability to survive. For example, a combination of sight, touch, smell, and taste may indicate whether a substance is edible[2].
阅读1:资料1.docx~~任务要求
- 2022-03-05
洋面风多源融合实况分析产品及历史产品研制
↑ 王老师主要细化有批准部分模块的功能点。模块下的功能点写法。模块如果超过10万以上,应细化出多个功能点,一个功能点5万左右。
数据预处理(5个模块)
风云卫星洋面风场预处理模块:实现洋面风融合中,
需要风云卫星洋面风场数据的预处理,包括实时、历史输入数据文件中特定变量的投影转换、分辨率转换,
在技术资料里面有~
实现与融合模块的对接,保证融合质量,
同时实现历史数据的预处理,达到历史数据集制作要求。
海洋卫星洋面风场预处理模块:实现洋面风融合中,
需要海洋卫星洋面风场数据的预处理,包括实时、历史输入数据文件中特定变量的投影转换、分辨率转换,
实现与融合模块的对接,保证融合质量。
同时由于海洋卫星与气象卫星的风向定义方式不同,因此预处理模块还要实现风向的转换,保证风向定义的一致性,
同时实现历史数据的预处理,达到历史数据集制作要求。
海洋卫星用散射计
其他卫星洋面风场预处理模块:随着数据共享与国际交换的不断发展,未来将有更多的卫星洋面风场满足实时性要求,如windsat、风神等卫星反演洋面风产品,将进一步提升实时产品精度,因此针对未来新增洋面风反演数据,也需要提前参照历史数据开发其他卫星洋面风场数据的预处理,包括
输入数据文件中特定变量的投影转换、分辨率转换,
实现与融合模块的对接,保证融合质量,
同时实现历史数据的预处理,达到历史数据集制作要求。
国际上准备发射,还没发射
↑ 卫星
海基洋面风观测预处理模块:
基于大数据云平台实现洋面风融合中需要浮标、船舶、海上平台等多种洋面风实际观测数据的获取,
并利用元数据信息实现探风仪器距海面高度的确定,挑选符合10m风场定义的实际观测,
风是算出来的
模式手册,把不同高度的风转化成10m风,(给个公式)
并按照融合模块要求,将实际观测数据输出,
同时实现历史数据的预处理,达到历史数据集制作要求。
↑ 观测
数值预报模式数据预处理模块:依据洋面风融合所需的ECMWF或CRA模式风场数据格式及内容,
实现模式洋面风场的投影转换、分辨率转换,
25km 的,转换成 10km,
实现与融合模块的对接,保证融合质量,
同时实现历史数据的预处理,达到历史数据集制作要求。
↑ 数值预报模式
SSSSSSSSSSSSSSSSSSSSSSSSSSSSSSSSSSSSSSSSSSSSSSSSSSSSSSSS
QT:风云卫星、海洋卫星
SSSSSSSSSSSSSSSSSSSSSSSSSSSSSSSSSSSSSSSSSSSSSSSSSSSSSSSS
洋面风融合(5个模块)
卫星洋面风数据检查模块:
首先根据散射计和辐射计等卫星遥感洋面风产品的质量控制码剔除异常数据或对异常数据进行插补;
再根据融合产品区域的海陆分布,剔除陆上格点、海陆混合格点及距离陆地较近格点的数据,将陆地对探测数据的影响降到最低;
然后结合所用背景场数据,进行融合前的背景场差异检查,剔除差异明显超出部分的数据,
最后将卫星产品梳理成待融合的高质量卫星遥感洋面风数据。
同时实现对历史数据的检查,达到历史数据集制作要求
看看卫星的数据形式
↑ 廖志宏:该模块18w,需要分功能,每个功能不超过5w,请参照5.1.5.1“台风大数据存储”格式编写。
卫星洋面风偏差订正模块:
针对待融合的散射计和辐射计等洋面风数据,利用浮标等现场观测数据进行验证和校准。
采用线性和非线性回归方法,获取不同卫星洋面风数据与现场观测数据的函数关系,进而对卫星遥感散射计和辐射计数据进行偏差订正,以获取无偏的待融合卫星洋面风数据。
什么是偏差订正?,机器学习~~
同时实现对历史数据的偏差订正,达到历史数据集制作要求。
↑ 廖志宏:该模块18w,需要分功能,每个功能不超过5w,请参照5.1.5.1“台风大数据存储”格式编写。
UV风场融合模块:
采用逐步订正、最优插值、多重网格三维变分等融合算法,将现场观测洋面风数据、卫星遥感观测洋面风数据和模式输出的网格化背景洋面风数据转换为UV风场,分别进行融合,从而获得高时空分辨率的全球、区域和近岸网格化UV风场融合产品。
↑ 很期待去做~~都可以改的,往技术发展的方向改~
风速的融合,分成U和V
散射计有UV现在不是思考怎么做,而是思考怎么写~
有背景场是好融合的
简单的插值,没有背景场,融合很难的~同时利用UV风场计算洋面风向和洋面风速,方便洋面风速模块的使用。
并具备对历史数据的融合功能,满足对多种来源历史数据融合要求。
↑ 廖志宏:该模块18w,需要分功能,每个功能不超过5w,请参照5.1.5.1“台风大数据存储”格式编写。
洋面风速融合模块:
由于微波探测器反演的洋面风速产品更准,最大风量级更大,因此需要将多颗卫星的微波反演风速产品与上一步融合的洋面风速进一步融合,提升洋面风风速融合产品质量。
有些数据是没有UV的,只有风速~
并具备对历史数据的融合功能,满足对多种来源历史数据融合要求。
并具备对不同来源历史洋面风速数据的融合功能,满足历史回算模块一键回算的要求。
↑ 廖志宏:该模块14.4w,需要分功能,每个功能不超过5w,请参照5.1.5.1“台风大数据存储”格式编写。
历史数据回算模块:
历史回算模块主要分为
- 单点时间历史数据回算、
- 多点时间历史数据回算、
- 单一连续时间段历史数据回算、
- 混合时间设置历史数据回算。
通过配置
- 输入数据(岸基观测洋面风、各种海洋气象卫星及海基观测等)、
- 数据产品目录、
- 回算时次信息
后,可实现一键式回算。
同时实现历史数据集的制作。
↑ 廖志宏:该模块18w,需要分功能,每个功能不超过5w,请参照5.1.5.1“台风大数据存储”格式编写。
海浪多源融合实况分析产品研制
↑ 王老师主要细化有批准部分模块的功能点。模块下的功能点写法。模块如果超过10万以上,应细化出多个功能点,一个功能点5万左右
数据预处理(3个模块)
海洋卫星海浪产品预处理模块:
实现海浪融合中需要海洋卫星海浪产品的预处理,包括输入数据文件中特定变量的投影转换、分辨率转换,
实现与融合模块的对接,保证融合质量。
同时实现历史数据的预处理,达到历史数据集制作要求。
海洋卫星的高度计产品
海洋卫星波谱仪产品预处理模块
其他卫星海浪产品预处理模块:
实现海浪融合中需要其他卫星海浪产品的预处理,包括输入数据文件中特定变量的投影转换、分辨率转换,
实现与融合模块的对接,保证融合质量。
同时实现历史数据的预处理,达到历史数据集制作要求。
有其他卫星的吗?
海基海浪观测预处理模块:
- 基于大数据云平台实现海浪融合中需要浮标、船舶、海上平台等多种海浪实际观测数据的获取,
- 并按照融合模块要求,将实际观测数据输出。
- 同时实现历史数据的预处理,达到历史数据集制作要求。
海浪融合(7个模块)
卫星反演海浪产品数据检查模块:
- 根据产品质量控制码挑选质量可靠的数据;
- 再根据融合产品区域的海陆分布,剔除陆上格点、海陆混合格点及距离陆地较近格点的数据,将陆地对探测数据的影响降到最低;
- 然后结合所用背景场数据,进行融合前的背景场差异检查,剔除差异明显超出部分的数据,最后梳理成待融合的高质量数据。
- 同时实现历史数据的检查,达到历史数据集制作要求。
↑ 廖志宏:该模块14.4w,需要分功能,每个功能不超过5w,请参照5.1.5.1“台风大数据存储”格式编写。
卫星反演海浪产品偏差订正模块:
- 卫星反演海浪产品与海浪背景场之间存在一定的偏差,在利用海浪模式对卫星反演海浪产品同化前,需要模式数据对卫星反演海浪产品进行偏差订正,
- 并将待同化数据制成海浪同化模式所需的标准格式。
- 同时实现历史数据的偏差订正,达到历史数据集制作要求。
↑ 廖志宏:该模块18w,需要分功能,每个功能不超过5w,请参照5.1.5.1“台风大数据存储”格式编写。
海浪模式构建模块:
- 构建WAVEWATCH-III和SWAN嵌套的海浪模式,对全球、区域和近岸海域进行海浪模拟,大区域海浪模式为小区域海浪模式提供海浪谱边界条件。
- 优化风-浪相互作用、波-波相互作用、底摩擦和波浪破碎等方案,获取多种海浪要素。
↑ 廖志宏:该模块18w,需要分功能,每个功能不超过5w,请参照5.1.5.1“台风大数据存储”格式编写。
海浪数据同化模块:
采用最优插值、集合卡尔曼滤波等同化方法,将预处理的海浪有效波高观测数据与构建的海浪嵌套模式有机结合,发挥同化方法的优势,提高海浪模式输出要素的精度。
同化技术涉及非对角的观测误差协方差矩阵构建、流依赖背景误差协方差矩阵的构造、方差膨胀和协方差局地化策略、基于分水岭算法的谱分割策略等。
↑ 我开始兴奋了~~😘同时实现对历史数据的同化,达到历史数据集制作要求。
↑ 廖志宏:该模块18w,需要分功能,每个功能不超过5w,请参照5.1.5.1“台风大数据存储”格式编写。
海浪模式产品后处理模块:
- 对海浪同化模式的输出要素进行标准化处理,制作全球、区域和近岸多套不同时空分辨率、不同要素的网格化海浪产品。
- 制作与Jason-3等高度计同步的沿轨海浪有效波高数据集。
- 同时实现对历史模式产品后处理,达到历史数据集制作要求。
↑ 廖志宏:该模块18w,需要分功能,每个功能不超过5w,请参照5.1.5.1“台风大数据存储”格式编写。
海浪有效波高融合模块:
将海浪同化模式输出的、不同分辨率网格化有效波高数据作为背景场,采用最优插值、多重网格三维变分等融合方法,对雷达反演海浪波高、卫星遥感海浪有效波高和现场观测有效波高数据进行高质量时空融合。获得高时空分辨率的全球、区域和近岸网格化的海浪有效波高融合产品。
↑ 再同化一次?同化与融合不一样?同时具备历史数据融合功能,达到历史数据回算模块要求,实现历史数据的融合。
↑ 廖志宏:该模块18w,需要分功能,每个功能不超过5w,请参照5.1.5.1“台风大数据存储”格式编写。
历史数据回算模块:
历史回算模块主要分为
- 单点时间历史数据回算、
- 多点时间历史数据回算、
- 单一连续时间段历史数据回算、
- 混合时间设置历史数据回算
通过配置
- 输入数据(岸基观测海浪产品、海洋卫星及海基观测数据)、
- 数据产品目录、
- 回算时次信息
后,可实现一键式回算,
实现历史数据集的制作。
阅读2:其他项目的初设——请避免重复——暂不用参考本文档的格式.docx~~模块模板
多源卫星反演洋面风订正模块
↑ 1.1.1.1 多源卫星反演洋面风订正模块
1. 概述
针对不同卫星和不同洋面风反演算法,造成的不同来源卫星洋面风资料之间的差异,
开发基于现场实测数据的卫星洋面风资料的误差特征分析与误差订正模块,
实现不同来源的卫星洋面风资料之间存在系统性差异的消除,
降低平台因素给融合产品带来的误差。
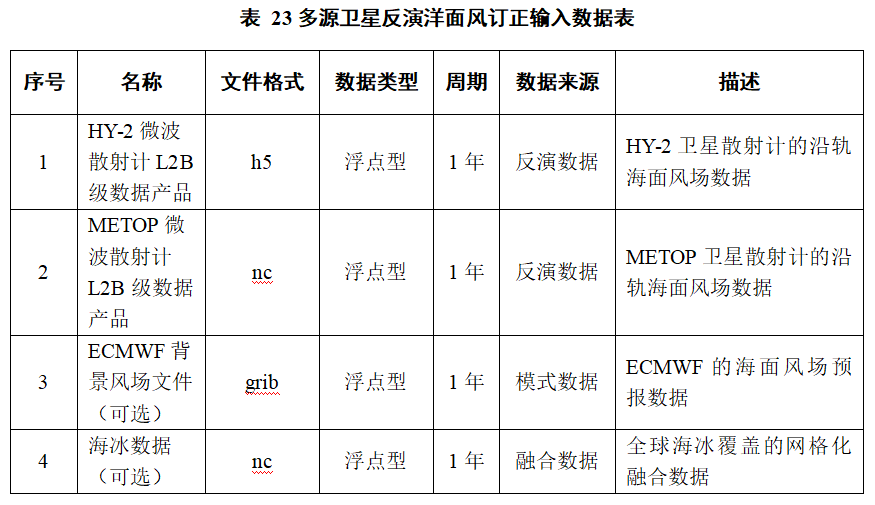
2. 输入
3. 数据处理
(1)模型算法描述
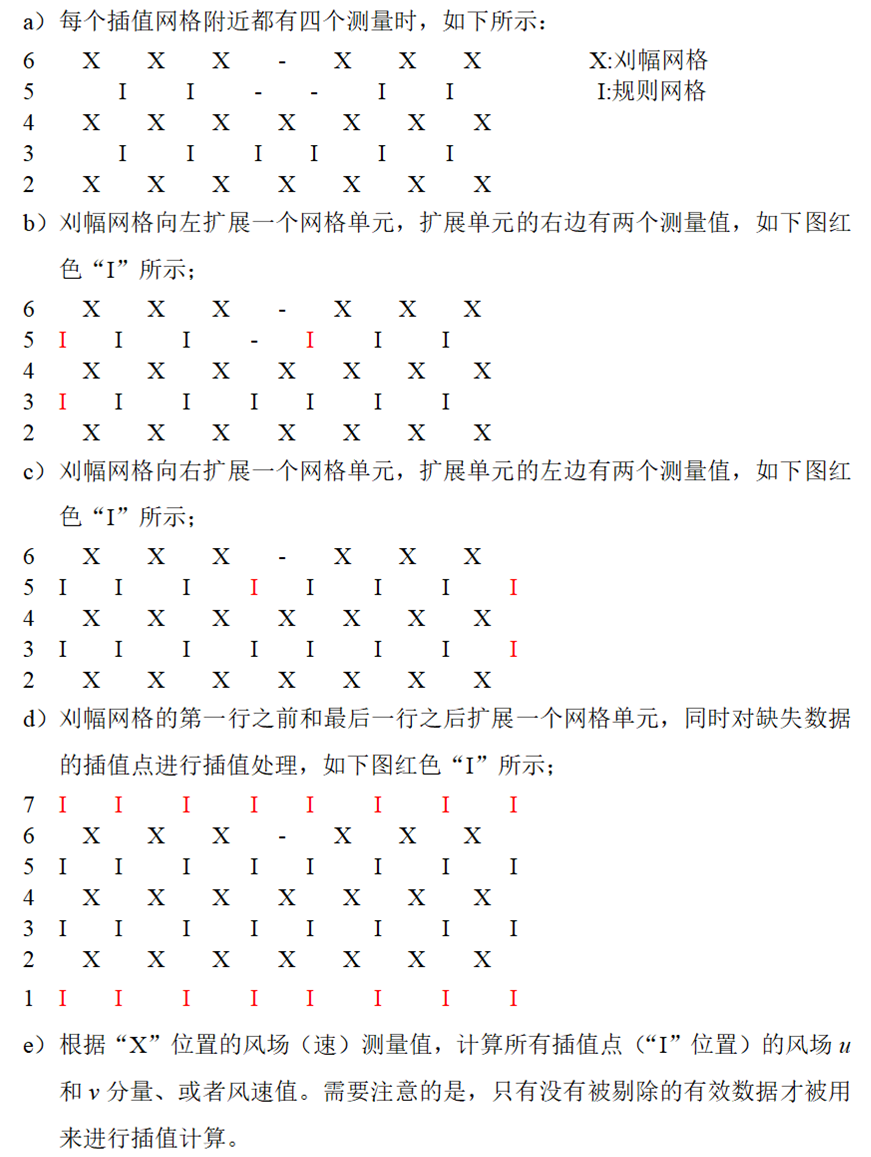
多源卫星反演洋面风订正模块将按刈幅排列的风场数据转换成按经纬度规则排列的风场数据。
规则经纬度网格是指相邻网格中心的经度和纬度的间隔都是0.25°;经度的坐标刻度起点是0.125°、终点是359.875°,共1440点;纬度的坐标刻度起点是-89.875°、终点是89.875°,共720点。
为了尽可能保证风场观测的覆盖空间范围,网格转化首先要按以下流程对刈幅网格进行预处理(以下成为插值):
插值的物理参量为,

最后,三角形内部p点位置插值的物理参量为:

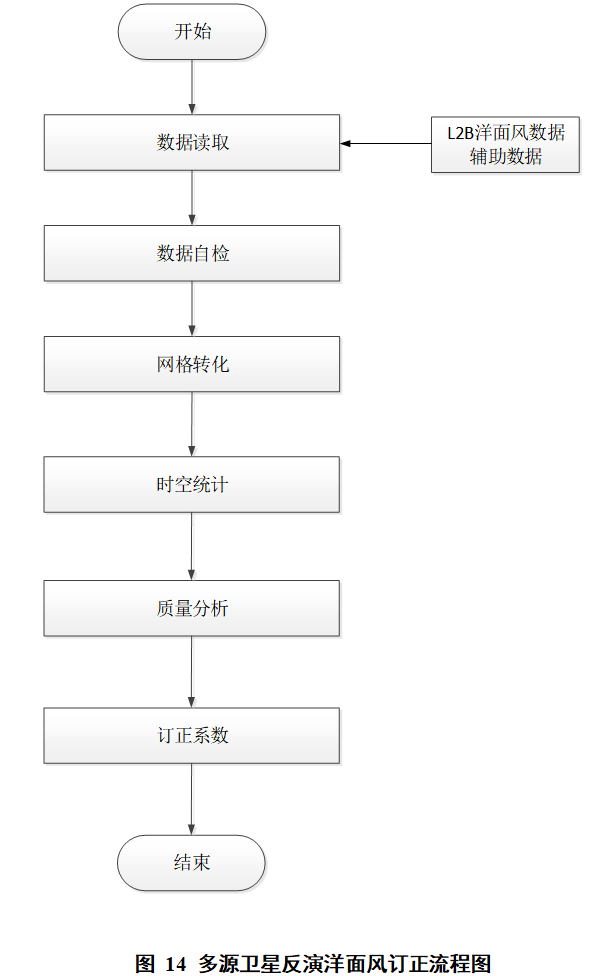
(2)数据处理流程
- 数据读取:主要是实现HY-2和METOP卫星微波散射计L2B级产品和背景风场产品的数据读取;
- 数据自检:根据残差和风单元质量标识符提取HY-2和METOP卫星微波散射计有效的海面风场信息,以便用于后续的网格转化处理和时空统计分析。;
- 网格转化:网格转化模块承接数据自检的输出,将按刈幅排列的风场数据转换成按经纬度规则排列的风场数据。
- 时空统计:根据网格化的散射计风场和数值天气预报模式提供的背景风场,统计分析每个网格点两种风场经向(u)和纬向(v)分量的均值和方差。
- 质量分析:根据时空统计分析模块的结果,分析每个网格点数据统计分显著程度,如果统计显著性小于设定的阈值,将该网格点的风场设置成缺省值。
- 订正系数:根据HY-2和METOP卫星微波散射计L2B级产品的统计分析和质量分析结果,计算多源洋面风场数据的订正系数。
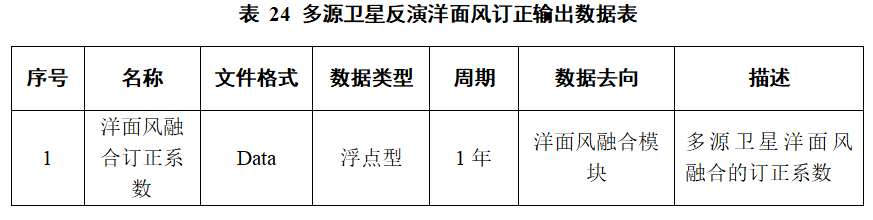
4. 输出
↓↓ 后面的模块基本是一个形式~
洋面风二维变分融合模块
↑ 1.1.1.2 洋面风二维变分融合模块
洋面风最优插值融合模块
↑ 1.1.1.3 洋面风最优插值融合模块
洋面风融合产品生成模块
↑ 1.1.1.4 洋面风融合产品生成模块
多源卫星反演有效波高订正模块
↑ 1.1.1.5 多源卫星反演有效波高订正模块
有效波高最优插值融合模块
↑ 1.1.1.6 有效波高最优插值融合模块
有效波高克里金插值融合模块
↑ 1.1.1.7 有效波高克里金插值融合模块
有效波高逐步订正融合模块
↑ 1.1.1.8 有效波高逐步订正融合模块
有效波高融合产品生成模块
↑ 1.1.1.9 有效波高融合产品生成模块
阅读3:洋面风海浪等模块-wjc20180616.docx~~模板模块
- 2018
- 全是干货~~😎
卫星洋面风质量控制模块
自动下载散射计和辐射计等卫星遥感洋面风产品,剔除异常数据或对异常数据进行插补;进行空间检查、阈值检查、时间检查并进行与背景场的差异检查;将下载的卫星产品梳理成待融合的高质量卫星遥感洋面风数据。
技术路线及软件开发:
(1) 自动获取公开的ASCAT、HY-2等散射计洋面风产品和AMSR-E、TMI等微波辐射计洋面风产品,对卫星遥感产品进行解码、读取,写成标准格式;
(2) 判断异常数据标志,剔除异常数据,或通过时空插值方法,利用相邻洋面风数据对异常数据进行插补;
(3) 判断海陆冰标志,进行洋面风数据的空间检查,去除陆地和冰上的洋面风数据;
(4) 确定风速的阈值,对洋面风数据进行阈值检查,以确保其在合理的范围之内,减少因高误差引起的数据不确定性;
(5) 融合之前进行时间检查,判断待融合卫星遥感洋面风数据是否在融合时间窗口内,保证数据源的准确性,彻底消除时间错位;
(6) 进行与背景场的差异检查,若卫星观测与背景场差异超出了阈值,则剔除该观测数据以保证观测与背景场的相容性。
卫星洋面风偏差订正模块
针对待融合的散射计和辐射计等洋面风数据,利用浮标等现场观测数据进行验证和校准。采用线性和非线性回归方法,获取不同卫星洋面风数据与现场观测数据的函数关系,进而对卫星遥感散射计和辐射计数据进行偏差订正,以获取无偏的待融合卫星洋面风数据。
技术路线及软件开发:
(1) 获取浮标、船舶等现场观测洋面风数据,并对其进行质量控制和标准化处理;
(2) 针对不同分辨率的洋面风融合,选择不同的时间和空间窗口,以进行回归。如全球0.25°逐1小时的融合,采用30分钟的时间窗口和50公里的空间窗口;
(3) 把浮标等现场洋面风数据作为真值,采用最小二乘回归方法,获取不同卫星洋面风数据与现场观测数据的线性或非线性关系,建立不同散射计和辐射计等的风速(风向)回归公式;
(4) 通过回归关系对卫星遥感散射计和辐射计数据进行偏差订正,以获取无偏的待融合卫星洋面风数据,并将订正后的卫星洋面风数据写成标准格式。
多源洋面风融合模块
采用逐步订正、最优插值、多重网格三维变分等融合算法,将现场观测洋面风数据、卫星遥感观测洋面风数据和模式输出的网格化背景洋面风数据进行融合,获得高时空分辨率的全球、区域和近岸网格化洋面风融合产品。用现场观测和再分析洋面风资料对融合洋面风场进行验证和评估。
技术路线及软件开发:
(1) 获取船舶、台站、浮标等现场观测洋面风数据和模式输出的网格化背景洋面风数据,并进行标准化处理;
(2) 将多种待融合的现场和偏差订正后的卫星遥感洋面风数据进行处理,针对融合产品不同时空分辨率的要求,进行“瘦数据处理”,形成融合时刻的超级观测场文件;
(3) 采用逐步订正、最优插值、多重网格三维变分等融合算法,将浮标等现场观测和散射计等卫星遥感观测与背景洋面风场进行融合,获得高时空分辨率的全球、区域和近岸网格化的、包括风速和风向的洋面风融合产品;
(4) 自动下载ECMWF等再分析洋面风数据产品,为洋面风融合产品检验评估做数据准备;
(5) 针对全球、区域和近岸的洋面风融合产品采用不同的时空窗口进行数据匹配,采用均方根误差、相关系数等统计因子,用现场观测和再分析洋面风资料对融合洋面风场进行验证和评估。
多源海浪观测预处理模块
获取浮标、测波雷达等现场观测海浪数据以及高度计、波谱仪和SAR卫星遥感观测海浪数据并进行质量控制,利用现场海浪观测对卫星遥感海浪观测进行偏差订正,将待同化数据制成海浪同化模式所需的标准格式。
技术路线及软件开发:
(1) 自动下载Jason-3、HY-2等卫星高度计海浪有效波高数据,CFOSAT波谱仪、SAR等卫星遥感观测的二维海浪谱数据,进行质量控制;
(2) 通过最小二乘等回归方法,利用现场海浪观测对卫星高度计海浪观测, 获取不同卫星高度计海浪数据与现场观测数据的线性或非线性关系,建立海浪有效波高回归公式;
(3) 通过回归关系对卫星遥感高度计数据进行偏差订正,以获取无偏的卫星高度计海浪有效波高数据,并将订正后的卫星有效波高数据写成标准格式;
(4) 将待同化的海浪有效波高、平均周期、平均波向、二维海浪谱等数据制成海浪同化模式所需的标准格式。
海浪模式构建模块
构建WAVEWATCH-III和SWAN嵌套的海浪模式,对全球、区域和近岸海域进行海浪模拟,大区域海浪模式为小区域海浪模式提供海浪谱边界条件。优化风-浪相互作用、波-波相互作用、底摩擦和波浪破碎等方案,获取多种海浪要素。
技术路线及软件开发:
(1) 研究海浪模式WAVEWATCH-III和SWAN的风-浪相互作用、波-波相互作用、底摩擦和波浪破碎等的优化方案,针对全球、区域和近岸不同情况,制定最优的参数化方案;
(2) 研究WAVEWATCH-III和SWAN的嵌套方式,研究WAVEWATCH-III的规则网格和SWAN的非结构网格在嵌套时的边界处理方案,采用三层嵌套,全球海浪模式为区域海浪模式提供边界条件,区域海浪模式为近岸海浪模式提供边界条件;
(3) 获取驱动场数据,结合初始条件和边界条件构建不同时空分辨率的海浪嵌套模式,全球模式空间水平分辨率达到25公里,近岸海浪模式空间水平分辨率达到4公里;
(4) 输出不同分辨率的海浪要素,包括:有效波高、均值周期、峰值周期、均值波向、峰值波向、峰值频率、风浪波高、风浪方向、第一涌浪波高、第一涌浪方向等。
海浪数据同化模块
采用最优插值、集合卡尔曼滤波等同化方法,将预处理的海浪有效波高观测数据与构建的海浪嵌套模式有机结合,发挥同化方法的优势,提高海浪模式输出要素的精度。同化技术涉及非对角的观测误差协方差矩阵构建、流依赖背景误差协方差矩阵的构造、方差膨胀和协方差局地化策略、基于分水岭算法的谱分割策略等。
技术路线及软件开发:
(1) 根据海浪遥感观测数据的特点,考虑观测误差的相关性,研究观测误差的统计性质,构建非对角的观测误差协方差矩阵;分析观测误差的相关性对同化效果的影响,考虑计算复杂度,探求最优的非对角观测误差协方差矩阵;
(2) 采用集合卡尔曼滤波方法,用集合思想解决背景误差协方差矩阵估计和预报困难问题,把误差的统计量隐含在一组预报变量中进行预报,然后根据该组预报值的差异进行统计,得到新的误差协方差,构建流依赖的背景场误差协方差矩阵;
(3) 研究方差膨胀和协方差局地化策略,解决集合同化方法中抽样误差会导致模式状态背景方差的低估和观测与模式状态之间存在长距离伪相关问题,开发一种简单有效的协方差局地化和方差膨胀的补偿机制,从而有效提高集合滤波的同化效果;
(4) 针对海浪有效波高不足以纠正模式产生的海浪谱的问题,基于分水岭算法,改进谱分割策略,将分割的二维海浪谱数据融入同化方法中,建立可直接同化二维谱数据的同化算法;
(5) 将预处理的海浪有效波高观测数据以及二维海浪谱数据与构建的海浪嵌套模式有机结合,发挥同化方法的优势,构建更优的海浪分析场,提高海浪模式输出要素的精度。
海浪模式产品后处理模块
对海浪同化模式的输出要素进行标准化处理,制作全球、区域和近岸多套不同时空分辨率、不同要素的网格化海浪产品。制作与Jason-3等高度计同步的沿轨海浪有效波高数据集。
技术路线及软件开发:
(1) 将海浪同化模式输出的有效波高、均值周期、峰值周期、均值波向、峰值波向、峰值频率、风浪波高、风浪方向、第一涌浪波高、第一涌浪方向等海浪要素进行标准化处理;
(2) 制作不同时空分辨率、不同海浪要素的网格化产品,全球区域空间水平分辨率达到25公里,近岸区域空间水平分辨率达到4公里;
(3) 提供全球、区域和近岸的网格化海浪有效波高数据,以作为海浪有效波高融合产品所需的背景场数据;
(4) 设置模式输出,制作与Jason-3等高度计同步的沿轨海浪有效波高数据集,对比分析模式输出有效波高数据的质量。
海浪有效波高融合模块
将海浪同化模式输出的、不同分辨率网格化有效波高数据作为背景场,采用最优插值、多重网格三维变分等融合方法,对卫星遥感海浪有效波高和现场观测有效波高数据进行高质量时空融合。获得高时空分辨率的全球、区域和近岸网格化的海浪有效波高融合产品。用现场观测和再分析海浪有效波高资料对融合有效波高产品进行验证和评估。
技术路线及软件开发:
(1) 获取船舶、台站、浮标等现场观测海浪有效波高数据和模式输出的网格化背景有效波高数据,并进行标准化处理;
(2) 将多种待融合的现场和偏差订正后的卫星遥感海浪有效波高数据进行处理,针对融合产品不同时空分辨率的要求,进行“瘦数据处理”,形成融合时刻的超级观测场文件;
(3) 采用逐步订正、最优插值、多重网格三维变分等融合算法,将浮标等现场观测和高度计等卫星遥感观测与海浪模式输出的背景有效波高场进行融合,获得高时空分辨率的全球、区域和近岸网格化的有效波高融合产品;
(4) 自动下载ECMWF等再分析有效波高数据产品,为有效波高融合产品检验评估做数据准备;
(5) 针对全球、区域和近岸的有效波高融合产品采用不同的时空窗口进行数据匹配,采用均方根误差、相关系数等统计因子,用现场观测和再分析有效波高资料对融合有效波高产品进行验证和评估。
阅读4:风场融合实施方案word03.doc~~全球多源洋面风观测资料融合技术研究+卫星现状–2015
2015-08
↓ 对卫星数据介绍的那是相当的好↑ 相关机构和学者的数据融合找资料的机构方向↑ 常见的融合方法↑ 最优插值算法的公式
一、洋面风融合现状及趋势
洋面风(Sea surface wind)是决定海洋和大气之间动量、能量和质量交换的重要因素之一,
洋面风场是气象业务中广泛使用的基本要素之一, 在海洋和大气科学的研究中受到广泛关注。
- 高质量、高时空分辨率的洋面风数据对于影响大气和海洋的海气相互作用是至关重要的。
- 洋面风数据可以为海洋模式提供驱动场,
- 在计算海表热通量、湿度等要素时需要洋面风场,
- 同时,洋面风场可以为大气模式提供初始场和对模式结果进行验证。
1. 常规数据、再分析数据、卫星数据
获取洋面风的常规手段主要是
- 布设海上浮标、
- 建立沿岸和岛屿气象观测系统
- 以及海洋调查船走航观测等。
但是这些常规手段受到海上复杂的海况和天气条件的限制, 也几乎不可能获得大面积的海面风场信息。因此在以往的海洋和大气科学研究中,再分析资料成了主要的海面风场资料源。
↓ 对卫星数据介绍的那是相当的好~~
近年来, 卫星遥感监测方法的逐步成熟为海面风场的监测提供了新的手段。
- 从1987 年7月美国实施国防气象卫星计划(DMSP)以来, 逐步实现了海面风的业务化卫星探测。 到目前为止, 美国有6颗搭载了海面风观测传感器的卫星进行全球海面风的业务观测,其中包括DMSP系列卫星(F08,F10,F11,F13,F14,F15) 装载的专用微波成像仪微波辐射计SSM/I、TRMM卫星上装载的微波成像仪TMI、QuikSCAT卫星上装载的新型主动微波遥感仪散射计SeaWinds, 以及美国宇航局的卫星EOSAQUA上的高级微波扫描辐射计AMSR-E。
- 欧空局发射的ERS卫星上搭载有主动微波仪器AMI可获取全球的风速和风向数据,自2006年始,欧空局的系列卫星MetOp上搭载了高级散射计ASCAT,至今可获取全球的风场数据。
- 中国于2011年8月发射的HY-2卫星上同时载有微波散射计和微波辐射计,可获取全球洋面风场数据。据统计,在6小时的观测时间窗口内,对全球海洋的遥感探测采样率从1987 年的20 % 增长为2004年的 70 % 以上。
自1978年NASA发射了Seasat卫星以来,载有微波辐射计和微波散射计的海洋卫星列表如表1。
现在只用散射计~~
| 卫星 | 传感器 | 仪器类别 | 单位 | 服役时间 |
|---|---|---|---|---|
| Seasat | SASS | scatterometer | NASA | 1978.06-1978.10 |
| Seasat | SMMR | radiometer | NASA | 1978.06-1978.10 |
| ERS-1 | AMI-SCAT | scatterometer | ESA | 1991.07-2000.03 |
| ERS-2 | AMI-SCAT | scatterometer | ESA | 1995.04-2011.09 |
| ADEOS-1 | NSCAT | scatterometer | NASA | 1996.08-1997.06 |
| QuikSCAT | SeaWinds | scatterometer | NASA | 1999.07- 2009.12 |
| ADEOS-2 | SeaWinds | scatterometer | NASA | 2002.12-2003.08 |
| ADEOS-2 | AMSR | radiometer | NASA | 2002.12-2003.08 |
| DMSP(F08) | SSM/I | radiometer | NASA | 1987.07-1991.12 |
| DMSP(F10) | SSM/I | radiometer | NASA | 1990.12-1997.11 |
| DMSP(F11) | SSM/I | radiometer | NASA | 1991.12-2000.05 |
| DMSP(F13) | SSM/I | radiometer | NASA | 1995.05-2009.12 |
| DMSP(F14) | SSM/I | radiometer | NASA | 1997.05-2008.08 |
| DMSP(F15) | SSM/I | radiometer | NASA | 1999.12- |
| DMSP(F16) | SSMIS | radiometer | NASA | 2003.10- |
| DMSP(F17) | SSMIS | radiometer | NASA | 2006.12- |
| DMSP(F18) | SSMIS | radiometer | NASA | 2009.10- |
| TRMM | TMI | radiometer | NASA | 1997.12-2015.04 |
| EOSAQUA | AMSR-E | radiometer | NASA | 2002.05-2011.10 |
| GCOM-W1 | AMSR-2 | radiometer | NASA | 2012.05- |
| Coriolis | WindSat | polarimetric radiometer | 美国国防部 | 2003.01- |
| MetOp-1,2,3 | ASCAT | scatterometer | ESA | 2006.10- |
| HY-2 | KU-RFSCAT | scatterometer | CNSA | 2011.08- |
| HY-2 | MWRI | radiometer | CNSA | 2011.08- |
附部分缩略词:
ADEOS: Advanced Earth Observing Satellite
AMI: Active Microwave Instrument
AMSR-E: Advanced Microwave Scanning Radiometer - Earth Observing System
ASCAT: Advanced Scatterometer
CNSA: China National Space Administration
DMSP: Defense Meteorological Satellite Program
KU-RFSCAT: Ku-band Rotational Fan-beam Scatterometer
ERS: European Remote-Sensing Satellite
MWRI: Microwave Radiometer Imager
NCAR: National Center for Atmospheric Research
NCEP: National Center for Environmental Prediction
SASS: SEASAT-A Scatterometer System
SMMR: Scanning Multichannel Microwave Radiometer
SSM/I: Special Sensor Microwave Imager
SSMIS: Special Sensor Microwave Imager Sounder
TMI: TRMM Microwave Imager
TRMM: Tropical Rainfall Measuring Mission.
2. 融合产品及必要性
卫星搭载的微波散射计和扫描微波辐射计的沿轨数据仍不能完全覆盖全球海域,并且大气和海洋环境预报等部门在实际使用卫星遥感数据中通常需要用到全球化网格化的、具有较高的空间和时间分辨率标准数据。为了解决上述问题,数据融合被认为是非常有效的手段之一,通过数据融合可以优化遥感信息资源利用实现多源数据的优势互补。
QT:数据融合是为了实现获取全球数据的?
2009 年 5 月起美国国家航空航天局 (NASA) 的物理海洋学分布式档案中心(Physieal Oceanography Distributed Active Archive Center, PODAAC )实施了 “研究用途的地球系统数据记录计划”, 其以多源卫星探测的洋面风资料为基础,采用改进的变分同化方法合成了一种新的高分辨率( 25 km ) 交叉定标多平台卫星探测海面风场资料**(Cross-Calibrated, Multi-Platform ocean surface wind product, CCMP)**。NASA的遥感系统(Remote Sensing Systems,RSS)已经利用各种卫星测风仪器制作了高质量的海面10m处的洋面风场,最高空间分辨率为0.25°,时间分辨率为6小时。
ECMWF也以模式数据为背景风场,融合了若干现场和卫星观测风场产品,制作了全球0.25°逐6小时的洋面风产品。
许多学者在制定高分辨率、网格化的洋面风产品上也付出了许多努力。如Kako于2011年利用NCEP的再分析风场数据为背景风场,采用最优插值算法,融合了ASCAT散射计的沿轨数据,制作了全球0.25°逐6小时的洋面风数据,但是只提供2009.09至 2011.07的数据下载。
↑ 相关机构和学者的数据融合
上述网格化融合产品的时空分辨率都较高,但是对我国的HY-2散射计KU-RFSCAT皆未涉猎,而且对于精度较高的ASCAT散射计数据提及的也很少。鉴于此,本项目主要以HY-2散射计KU-RFSCAT和MetOp系列卫星上搭载的ASCAT风场产品为待融合产品,以来自NCEP/NCAR的再分析产品NRA1(NCEP Reanalysis Average)为背景风场,制作高精度的全球0.25°´0.25°逐6小时的洋面风数据。其中NRA1的全球网格分辨率为2.5°´2.5°,数据从1948年1月1日至今,是NOAA的ESRL(Earth System Research Laboratory)用分析/预报模式并执行数据同化得到的数据集。
↑ 创新点
3. 融合方法
数据融合算法主要包括反距离加权算法、克里金插值算法、逐步订正算法、混合分析算法、截断滤波窗的变分分析算法、客观分析算法、三维变分同化分析算法、卡尔曼滤波算法和最优插值算法。
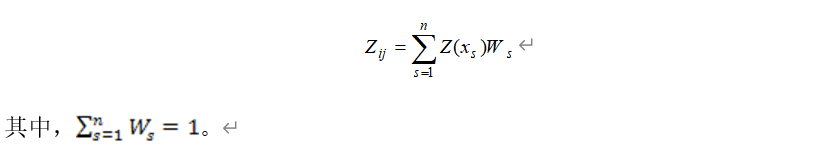
反距离加权法是目前最常用的空间插值方法**,该方法认为观测点离网格中心点越近, 其值的贡献越大; 距离越远, 贡献越小**。其计算公式为:
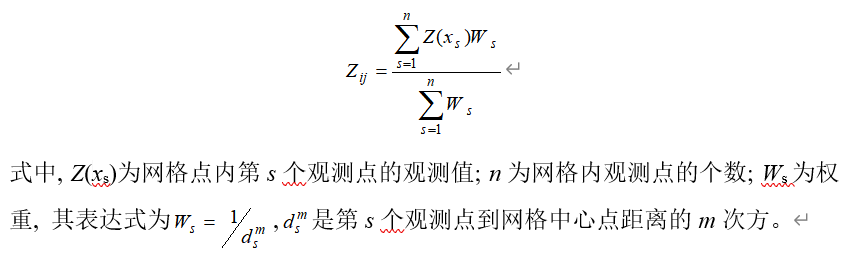
该方法中观测点到网格中心点的距离是最重要的参数, 它决定融合结果的好坏。
克里金插值法是对空间分布的数据求线性、无偏内插估计的一种方法,它的核心是求取变差函数。其计算公式为
选取适当的权重, 使网格中心点处的插值估计无偏, 并使方差小于任意观测值线性组合的方差。
研究表明,球状模型最适合有效波高数据融合。
在求取变差函数时, 确定基本滞后很重要, 它关系到变差函数的变异性和稳定性。如果卫星散射计的轨道在网格内有交叉点或者轨道非常接近, 这样直接计算得到的基本滞后就很小甚至为零, 最终无法得到正确的理论变差函数。
逐步订正算法由于仅使用当前的观测数据,因此时间上的记忆性差;
逐步订正法是通过用观测值与初猜场之差去订正初猜场,以便得到一个新的初猜场,直到该场十分逼近观测场,即它们的均方差达到最小。其计算公式如下:
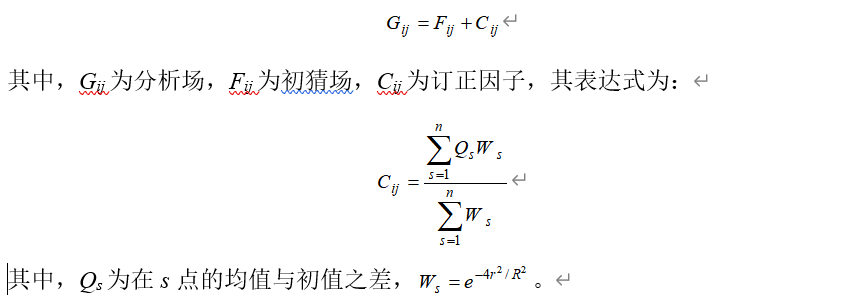
该方法的关键就是确定初猜场和选择影响半径。有效波高的空间尺度大概为30
100km, 初始影响半径至少为该尺度的34倍。随着迭代次数的增加初始影响半径应逐渐减小。混合分析算法也没有时间上的记忆性,且时空分辨率都很低,分析场被严重平滑;
统计最优估计算法和使用截断滤波窗的变分分析算法均选用了包括红外与微波在内的多种卫星遥感数据,空间分辨率高,但在有多种卫星遥感数据时,仅选取其中一种数据则可能给融合结果带入较大的噪声;
三维变分同化分析算法对计算机存储要求低,计算速度快,三维变分同化分析和最优插值算法分析一样,融合结果受到数据分布稀疏的限制;
最优插值算法可看作是卡尔曼滤波法的简化版,与卡尔曼滤波法相比,最优插值算法有以下几个方面的特点:
- 在误差的计算上,从卡尔曼滤波法的公式看,它的误差是发展的,这是卡尔曼滤波法最吸引人的地方,但这一直也是制约着卡尔曼滤波法应用的致命之处,因为它的计算量很大,而最优插值算法完全省略了这点,因此最优插值算法减少了很大的计算量,使得其误差变为静止的,
- 在最优插值算法的资料选择方面它通常只是选取分析点附近的资料来进行分析,这样大大减少了计算量。
- 最优插值算法通常只进行单变量分析,例如海面风场,
时间空间距离加权插值的优点是公式比较简单特别适用于结点散乱不是网格点的问题。
↑ 常见的融合方法
总的来说最优插值算法由于其计算量少,融合的性价比高,因此可以在单变量数据融合、洋面风场融合业务上得到广泛的应用。基于以上考虑,本项目选用最优插值算法对洋面风数据进行融合,并且可利用该方法进行业务化。
↑ 业务化:最优插值算法
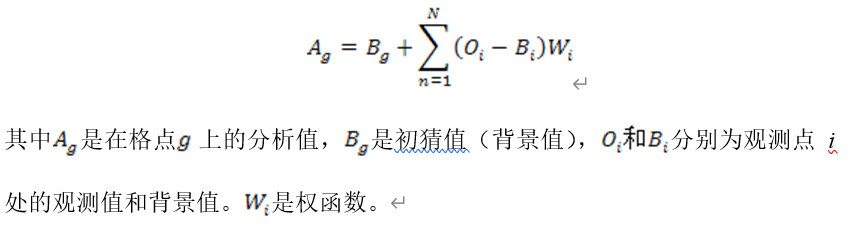
最优插值算法由于具备了部分卡尔曼滤波算法的优点并且计算量较小,在数据融合领域倍受青睐。
最优插值算法的基本公式为:
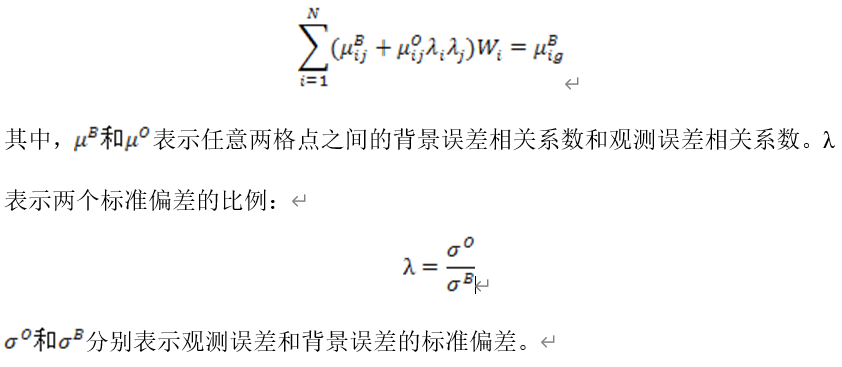
权函数由极小化一个误差协方差得到,可由解下面的公式得到:
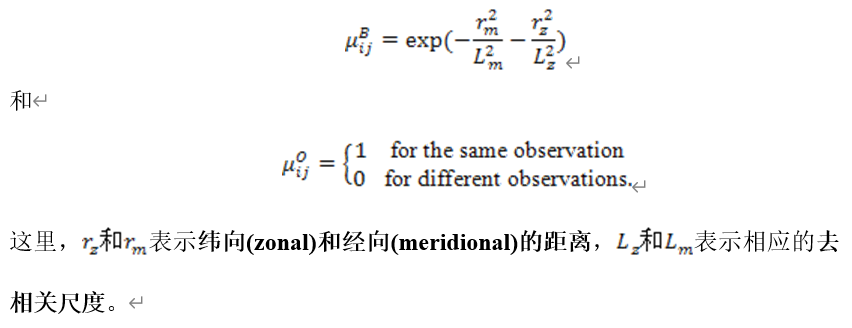
在进行网格化之前,用以下公式对 μ<sup>B</sup> 和 μ<sup>O</sup> 进行估计
↑ 最优插值算法的公式
本项目拟以 HY-2 散射计 KU-RFSCAT 和 MetOp 系列卫星上搭载的 ASCAT 散射计风场作为数据源、采用最优插值融合算法、结合 NCEP/NCAR 的再分析产品 NRA1 进行洋面风场的数据融合,制作全球逐 6 小时 0.25°×0.25° 的网格化洋面风融合产品,并对融合结果进行验证。
二、工作目标
在对星载散射计等洋面风资料进行系统偏差订正的基础上,以NCEP/NCAR的网格化产品NRA1为背景风场,制作高精度的全球逐6小时、0.25°×0.25°的网格化洋面风融合产品,并对融合产品进行验证。
三、工作内容
利用国家气象信息中心收集的船舶、浮标、卫星、模式等洋面风资料,开展卫星反演洋面风系统偏差订正以及多源洋面风融合技术研究,开发适合制作全球高分辨率(0.25°×0.25°,6小时)洋面风融合产品的融合技术模块。
评估多源洋面风观测资料的质量,制定订正多卫星遥感反演的洋面风资料的系统偏差订正方案,以及实现适合制作融合卫星、现场观测的高分辨洋面风产品的融合方法,研发针对全球洋面风多源观测数据的融合技术模块。
四、拟采取的方法和技术路线
洋面风场以ASCAT散射计、HY-2散射计数据为主,结合AMSR-E等微波辐射计数据进行。散射计数据基于数据编辑准则进行海面风矢量数据质量控制。结合实测数据,对散射计海面风场数据进行检验与修正。将经修正后的不同遥感数据源得出的洋面风场利用最优插值方法进行数据融合,得到全球的洋面风场参数。在此基础上,对融合后的洋面风场产品进行验证,最终得到洋面风场的时空分布图。具体技术流程如下图所示:
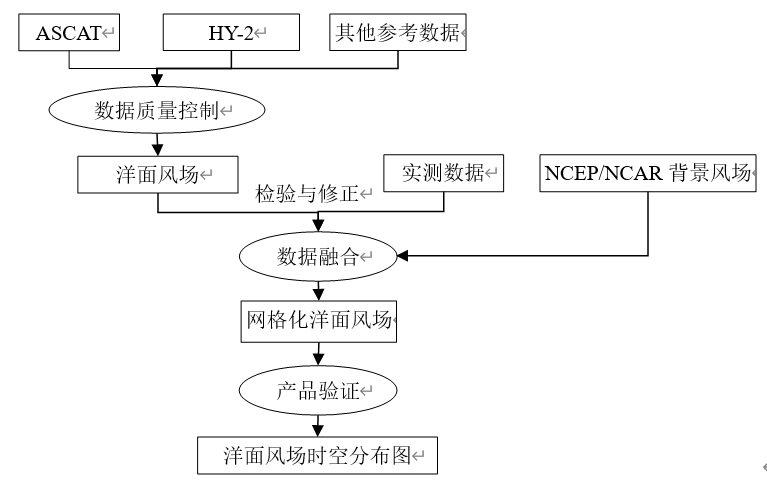
具体实施步骤如下:
1、在进行散射计等风场资料融合之前,需要对待融合数据进行质量控制,去除陆上以及冰上的点,剔除异常数据。
标记、阈值,有公式的尽量用公式~~
2、在质量控制完成之后,还需要利用浮标数据对散射计等数据进行验证和校准。一般来说,散射计数据的验证研究致力于获得相关的散射计和浮标观测的数据集,进而找出散射计数据最符合浮标数据的近似调整。要建立一个可接受的时间窗口,即一个最大的时间偏差,在这个偏差内散射计和浮标被认为是可比较的。相似的,对于散射计轨道和浮标的位置,要建立一个可接受的空间窗口。基于对洋面风场的时空变化的评估,普遍的一个准则是:空间窗口取为50km,时间窗口为30分钟。把浮标数据作为真值,校正过程是在浮标数据之上回归散射计数据。
3、获取NCEP/NCAR的再分析产品NRA1。此产品的网格分辨率为2.5°×2.5°,在经度和纬度方向通过线性插值,把网格大小插值为0.25°×0.25°。对于陆地和冰上的格点数据进行识别,对异常数据进行处理。考虑到风场是有两个分量组成的矢量,进行插值时需要对两个分量单独进行插值,这样就保留了风向的信息。
4、将插值后的NRA1作为背景风场,通过最优插值算法,融合ASCAT和HY-2散射计风场资料,得到全球0.25°×0.25°网格风场数据。对风场的两个分量分别进行最优插值,最终得到的是网格化的洋面风场的U、V分量场。
5、基于浮标数据,对融合产品进行验证和评估,给出全球洋面风场的时空分布图。
五、预期成果
1、卫星反演洋面风系统偏差订正模块程序**(Fortran)**;
2、多源洋面风资料融合算法说明及模块程序**(Fortran)**;
3、生成全球区域的逐6小时、0.25°×0.25°洋面风实验融合产品(NetCDF),并对融合产品进行验证和质量评估。
六、工作计划及阶段考核指标
1.工作计划
2015年8月~2015年12月:NDBC浮标等实测风场数据收集,ASCAT、HY-2散射计等基础风场资料收集与质量控制,NCEP/NCAR再分析风场数据收集;
2016年1月~2016年6月:利用浮标实测风场资料对待融合的卫星风场资料进行评估与偏差订正,进行风场融合算法研究;
2016年7月~2016年12月:根据最优插值风场融合算法,制作逐6小时、0.25°的全球洋面风场数据产品,产品时间周期为2011年8月-2014年8月;
2017年1月:形成各项研究报告与成果,提交程序与融合产品。
2.阶段性考核指标
2015年12月:完成基础信息资料收集,完成散射计风场的质量控制;
2016年6月:完成卫星散射计风场的验证与偏差订正,完成风场融合算法的研究;
2016年12月:完成全球逐6小时、0.25°的洋面风场数据产品制作;
2017年1月:完成项目任务,达到任务书规定的考核指标要求。
阅读5:RemoteSensors遥感仪器综述.doc
Overview
Remote sensing instruments are of two primary types—passive and active.
- Passive sensors detect natural energy (radiation) that is emitted or reflected by the object or scene being observed. Reflected sunlight is the most common source of radiation measured by passive sensors.
- Active sensors, on the other hand, provide their own source of energy to illuminate the objects they observe. An active sensor emits radiation in the direction of the target to be investigated. The sensor then detects and measures the radiation that is reflected or backscattered from the target.
↑ passive sensor 无源传感器,active sensor 有源传感器
↑ 介绍有源和无源传感器https://zhidao.baidu.com/question/1540081867768312507.html
Passive sensors
Passive sensors include different types of radiometers and spectrometers. Most passive systems used in remote sensing applications operate in the visible, infrared, thermal infrared, and microwave portions of the electromagnetic spectrum.
Passive remote sensors include the following:
- Accelerometer—An instrument that measures acceleration (change in velocity per unit time). There are two general types of accelerometers. One measures translational accelerations (changes in linear motions in one or more dimensions), and the other measures angular accelerations (changes in rotation rate per unit time).
- Radiometer—An instrument that quantitatively measures the intensity of electromagnetic radiation in some bands within the spectrum. Usually, a radiometer is further identified by the portion of the spectrum it covers; for example, visible, infrared, or microwave.
- Imaging radiometer—A radiometer that has a scanning capability to provide a two-dimensional array of pixels from which an image may be produced. Scanning can be performed mechanically or electronically by using an array of detectors.
- Spectrometer—A device that is designed to detect, measure, and analyze the spectral content of incident electromagnetic radiation. Conventional imaging spectrometers use gratings or prisms to disperse the radiation for spectral discrimination.
- Spectroradiometer—A radiometer that measures the intensity of radiation in multiple wavelength bands (i.e., multispectral). Many times the bands are of high-spectral resolution, designed for remotely sensing specific geophysical parameters
- Hyperspectral radiometer—An advanced multispectral sensor that detects hundreds of very narrow spectral bands throughout the visible, near-infrared, and mid-infrared portions of the electromagnetic spectrum. This sensor’s very high spectral resolution facilitates fine discrimination between different targets based on their spectral response in each of the narrow bands.
- Sounder—An instrument that measures vertical distributions of atmospheric parameters such as temperature, pressure, and composition from multispectral information.
The following table lists and describes many of the passive sensors whose data are supported by EOSDIS. Some of these sensors may overlap categories.
| Instrument | Type | Platform | Data Center | Comments |
|---|---|---|---|---|
| Single Channel/Total Power Radiometers and Imagers | ||||
| ACRIM II | Total power radiometer | UARS | ASDC | Measures total solar irradiance. |
| ACRIM III | Total power radiometer | ACRIMSAT | ASDC | Measures total solar irradiance. |
TIM |
Total power radiometer | SORCE | GES DISC | Measures total solar irradiance. |
LIS |
Imager | TRMM | GHRC DAAC | Detects intracloud and cloud-to-ground lightning, day and night. |
WFC |
Wide Field Camera | CALIPSO | ASDC | Fixed, nadir-viewing imager with a single spectral channel covering the 620-270 nm region. |
| Multispectral Instruments | ||||
| AMPR | Microwave radiometer | ER-2 andDC-8 | GHRC DAAC | Cross-track scanning total power microwave radiometer with four channels centered at 10.7, 19.35, 37.1 and 85.5 GHz. (FIRE ACE, Teflun-B, TRMM-LBA, CAMEX-4. TCSP, TC4 projects) |
| AMSR-E | Multichannel microwave radiometer | Aqua | NSIDC DAAC GHRC DAAC | Measures precipitation, oceanic water vapor, cloud water, near-surface wind speed, sea and land surface temperature, soil moisture, snow cover, and sea ice. Provides spatial resolutions of 5.4 km, 12 km, 21 km, 25 km, 38 km, 56 km, and 0.25 deg resolution. |
ASTER |
Multispectral radiometer | Terra | LP DAAC ORNL DAAC | Measures surface radiance, reflectance, emissivity, and temperature. Provides spatial resolutions of 15 m, 30 m, and 90 m. |
| AVHRR | Multispectral radiometer | NOAA/ POES | GES DISC NSIDC DAAC ORNL DAAC PO.DAAC | Has four or six bands, depending on platform. Telemetried resolutions are 1.1 km (HRPT data) and 4 km (Pathfinder V5 and GAC data). 5km, 25 km spatial resolution. |
CERES |
Broadband scanning radiometer | Aqua Terra TRMM NPP | ASDC | Has four to six channels (shortwave, longwave, total). Measures atmospheric and surface energy fluxes. Provides 20 km resolution at nadir. |
| IIR | Imaging Infrared Radiometer | CALIPSO | ASDC | Nadir-viewing, non-scanning imager having a 64 km swath with a pixel size of 1 km. Provides measurements at three channels in the thermal infrared window region at 8.7 mm, 10.5 mm, and 12.0 mm. |
MAS |
Imaging spectrometer | NASA ER-2 aircraft | GES DISC GHRC DAAC ASDC ORNL DAAC | Has 50 spectral bands. Provides spatial resolution of 50 m at typical flight altitudes. |
| MISR | Imaging spectrometer | Terra | ASDC ORNL DAAC | Obtains precisely calibrated images in four spectral bands, at nine different angles, to provide aerosol, cloud, and land surface data. Provides spatial resolution of 250 m to 1.1 km. |
MODIS |
Imaging spectroradiometer | Aqua Terra | GES DISC GHRC DAAC LP DAAC LAADS NSIDC DAAC OB.DAAC ORNL DAAC PO.DAAC | Measures many environmental parameters (ocean and land surface temperatures, fire products, snow and ice cover, vegetation properties and dynamics, surface reflectance and emissivity, cloud and aerosol properties, atmospheric temperature and water vapor, ocean color and pigments, and ocean biological properties). Provides moderate spatial resolutions of 250 m (bands 1 and 2), 500 m (bands 3-7), and 1 km (bands 8-36). |
| SSM/I | Multispectral microwave radiometer | DMSP | GHRC DAAC ASDC NSIDC DAAC PO.DAAC ORNL DAAC | Has seven channels and four frequencies. Measures atmospheric, ocean and terrain microwave brightness temperatures which are used to derive ocean near-surface wind speed, atmospheric integrated water vapor and cloud/rain liquid water content sea ice extent and concentration. |
| SMMR | Multispectral microwave radiometer | Nimbus-7 | GES DISC ASDC NSIDC DAAC PO.DAAC | Ten channels. Measured sea surface temperatures, ocean near-surface winds, water vapor and cloud liquid water content, sea ice extent, sea ice concentration, snow cover, snow moisture, rainfall rates, and differential of ice types. |
| TMI | Multispectral Microwave Radiometer | TRMM | GES DISC GHRC DAAC | TMI measures the intensity of radiation at five separate frequencies: 10.7, 19.4, 21.3, 37, 85.5 GHz. TMI measures microwave brightness temperatures, water vapor, cloud water, and rainfall intensity. |
| Ranging Instrument | ||||
| ACC | Accelerometer | GRACE | PO.DAAC | The Onera SuperSTAR Accelerometer measures the non-gravitational forces acting on the GRACE satellites. |
| Hyperspectral Instruments | ||||
AVIRIS |
Imaging spectrometer | Aircraft | ORNL DAAC | Has 224 contiguous channels, approximately 10 nm wide. Measurements are used to derive water vapor, ocean color, vegetation classification, mineral mapping, and snow and ice cover (BOREAS Project). |
SOLSTICE |
Spectrometer | SORCE | GES DISC | Measures the solar spectral irradiance of the total solar disk in the ultraviolet wavelengths from 115 to 430 nm. |
| Polarimetric Instruments | ||||
POLDER |
Polarimeter | Aircraft | ORNL DAAC | Measures the polarization and the directional and spectral characteristics of the solar light reflected by aerosols, clouds, and the Earth’s surface (BOREAS Project). |
| PSR | Microwave polarimeter | Aircraft | GHRC DAAC | Measures wind speed and direction (CAMEX-3 Project). |
| Sounding Instruments | ||||
AIRS |
Sounder | Aqua | GES DISC | Measures air temperature, humidity, clouds, and surface temperature. Provides spatial resolution of ~13.5 km in the IR channels and ~2.3 km in the visible. Swath retrieval products are at 50 km resolution. |
| AMSU | Sounder | Aqua | GES DISC GHRC DAAC | Has 15 channels. Measures temperature profiles in the upper atmosphere. Has a cloud filtering capability for tropospheric temperature observations. Provides spatial resolution of 40 km at nadir. |
| HAMSR | Sounder | DC-8 | GHRC DAAC | Measures vertical profiles of temperature, water vapor, from the surface to 100mb in 2-4 km layers. (CAMEX-4, NAMMA projects) |
| HIRDLS | Sounder | Aura | GES DISC | Measures infrared emissions at the Earth’s limb in 21 channels to obtain profiles of temperature, ozone, CFCs, various other gases affecting ozone chemistry, and aerosols at 1 km vertical resolution. In addition, HIRDLS measures the location of polar stratospheric clouds. |
MLS |
Sounder | Aura | GES DISC | Five broad band radiometers and 28 spectrometers measure microwave thermal emission from the limb of Earth’s atmosphere to derive profiles of ozone, SO2, N2O, OH and other atmospheric gases, temperature, pressure, and cloud ice. |
MOPITT |
Sounder | Terra | ASDC ORNL DAAC | Measures carbon monoxide and methane in the troposphere. Is able to collect data under cloud-free conditions. Provides horizontal resolution of ~22 km and vertical resolution of ~4 km. |
OMI |
Multispectral radiometer | Aura | GES DISC | Has 740 wavelength bands in visible and ultraviolet. Measures total ozone and profiles of ozone, N2O, SO2, and several other chemical species. |
| TES | Imaging Spectrometer | Aura | ASDC | High-resolution imaging infrared Fourier-transform spectrometer that operates in both nadir and limb-sounding modes. Provides profile measurements of ozone, water vapor, carbon monoxide, methane, nitric oxide, nitrogen dioxide, nitric acid carbon dioxide, and ammonia. |
Active sensors
The majority of active sensors operate in the microwave portion of the electromagnetic spectrum, which makes them able to penetrate the atmosphere under most conditions. An active technique views the target from either end of a baseline of known length. The change in apparent view direction (parallax) is related to the absolute distance between the instrument and target.
- Radar—An active radio detection and ranging sensor that provides its own source of electromagnetic energy. An active radar sensor, whether airborne or spaceborne, emits microwave radiation in a series of pulses from an antenna. When the energy reaches the target, some of the energy is reflected back toward the sensor. This backscattered microwave radiation is detected, measured, and timed. The time required for the energy to travel to the target and return back to the sensor determines the distance or range to the target. By recording the range and magnitude of the energy reflected from all targets as the system passes by, a two-dimensional image of the surface can be produced.
- Ranging Instrument—A device that measures the distance between the instrument and a target object. Radars and altimeters work by determining the time a transmitted pulse (microwaves or light) takes to reflect from a target and return to the instrument. Another technique employs identical microwave instruments on a pair of platforms. Signals are transmitted from each instrument to the other, with the distance between the two determined from the difference between the received signal phase and transmitted (reference) phase. These are examples of active techniques. An active technique views the target from either end of a baseline of known length. The change in apparent view direction (parallax) is related to the absolute distance between the instrument and target.
- Scatterometer—A high-frequency microwave radar designed specifically to measure backscattered radiation. Over ocean surfaces, measurements of backscattered radiation in the microwave spectral region can be used to derive maps of surface wind speed and direction.
- Lidar—A light detection and ranging sensor that uses a laser (light amplification by stimulated emission of radiation) radar to transmit a light pulse and a receiver with sensitive detectors to measure the backscattered or reflected light. Distance to the object is determined by recording the time between transmitted and backscattered pulses and by using the speed of light to calculate the distance traveled.
- Laser altimeter—An instrument that uses a lidar to measure the height of the platform (spacecraft or aircraft) above the surface. The height of the platform with respect to the mean Earth’s surface is used to determine the topography of the underlying surface.
- Sounder—An instrument that measures vertical distribution of precipitation and other atmospheric characteristics such as temperature, humidity, and cloud composition.
The following table lists and describes many of the active sensors whose data are supported by EOSDIS. Some of these sensors may overlap categories.
| Instrument | Type | Platform | Data Center | Comments |
|---|---|---|---|---|
| Altimeters - Radar and Laser (Lidar) | ||||
| ALT-A, -B | Radar altimeter | TOPEX/ Poseidon | PO.DAAC | Dual-frequency altimeter that measures height of the satellite above the sea (satellite range), wind speed, wave height, and ionospheric correction. |
| CALIOP | Cloud and Aerosol Lidar | CALIPSO | ASDC | Two-wavelength polarization-sensitive lidar that provides high-resolution vertical profiles of aerosols and clouds. |
| GLAS | Laser altimeter | ICESat | NSIDC DAAC | The main objective is to measure ice sheet elevations and changes in elevation through time. Secondary objectives include measurement of cloud and aerosol height profiles, land elevation and vegetation cover, and sea ice thickness. |
| Poseidon-1 | Radar altimeter | TOPEX/Poseidon | PO.DAAC | Single-frequency altimeter that measures height of the satellite above the sea (satellite range), wind speed, and wave height. |
| Poseidon-2 | Radar altimeter | Jason-1 | PO.DAAC | Measures sea level, wave height, wind speed, and ionospheric correction. |
| Scatterometers | ||||
| NSCAT | Radar scatterometer | ADEOS-I | PO.DAAC | Dual Fan-Beam Ku Band that measures ocean vector winds at a nominal grid resolution of 25 km. |
| SASS | Radar scatterometer | Seasat | PO.DAAC | Dual Fan-Beam Ku Band that measures ocean vector winds at a nominal grid resolution of 25 km. |
| SeaWinds | Radar scatterometer | QuikSCATADEOS-II | PO.DAAC | Dual Pencil-Beam Ku Band that measures ocean vector winds at a nominal grid resolution of 25 km. |
| Imaging Radar/SAR | ||||
| SAR | Synthetic aperature radar | ERS-1 ERS-2 JERS-1RADARSAT-1 PALSAR UAVSAR | ASF DAAC NSIDC DAAC ORNL DAAC | Provides high-resolution surface imagery at 7 to 240 m. Multiple polarizations are utilized by some SAR instruments. |
| Sounding Instruments | ||||
| CLS | Lidar | ER-2 | ASDC | Determines vertical cloud structure. (FIRE Project). |
| LASE | Lidar | DC-8 | GHRC DAAC | Measures water vapor, aerosols, and clouds throughout the troposphere (CAMEX-4, TCSP, NAMMA projects). |
| PR | Phased-array radar | TRMM | GES DISC ORNL DAAC | Measures 3-D distribution of rain and ice. Provides horizontal resolution of 250 m and vertical resolution of 5 km. |
| VIL | Lidar | Ground | ASDC ORNL DAAC | Determines vertical cloud structure (FIFE, FIRE and BOREAS Projects). |
| Ranging Instrument | ||||
| KBR | Ranging Instrument | GRACE | PO.DACC | The dual-frequency KBR instrument measures the range between the GRACE satellites to extremely high precision. |
待了解:earthdata.nasa.gov/learn/remote-sensors
Overview
Remote sensing instruments are of two primary types:
- Active sensors, provide their own source of energy to illuminate the objects they observe. An active sensor emits radiation in the direction of the target to be investigated. The sensor then detects and measures the radiation that is reflected or backscattered from the target.
- Passive sensors, on the other hand, detect natural energy (radiation) that is emitted or reflected by the object or scene being observed. Reflected sunlight is the most common source of radiation measured by passive sensors.
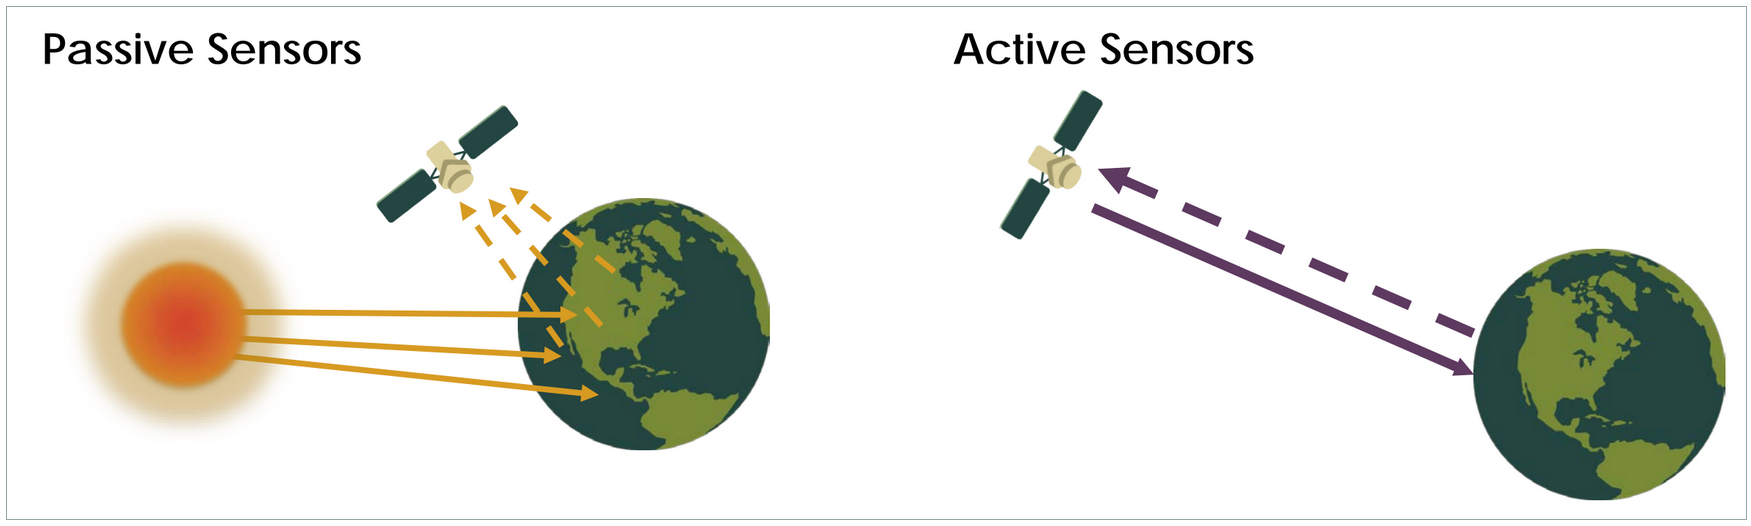
Table sensors
The following tables list and describe many of the active and passive sensors whose data are supported by EOSDIS. Some of these sensors may overlap categories. They are listed by current, future, and historic missions.
Search the remote sensors tables by clicking in the search boxes below and entering in a keyword term, such as a DAAC (ASDC, NSIDC, SEDAC, etc), a platform (ABoVE, CALIPSO, LIS ISS, etc), an instrument (GRACE, MODIS, TROPOMI, etc) or science term (surface mass, snow cover, tomography, etc). The search results will narrow down the table entries applicable to the search keyword entered.
Current Missions
Future Missions
Historic Missions
阅读6:伊比利亚半岛沿岸再分析、分析、卫星反演和 NWP 模拟风与浮标数据的比较-2014
英文名:Comparison of reanalyzed, analyzed, satellite- retrieved and NWP modelled winds with buoy data along the Iberian Peninsula coast
2014
期刊:《Remote Sensing of Environment》,
(2021)复合影响因子:10
1区
作者:D. Carvalho,等
机构:CESAM, Department of Physics, University of Aveiro, Campus Universitário de Santiago, 3810-193 Aveiro, Portugal
创新点:
good
↑ 四种数据:卫星、再分析、分析、WRF model,good↑ WRF 模拟的海上风是现场测量海上风数据的最佳替代方案↑ CCMP 和 IFREMER-BWF 可以被认为是 WRF 高分辨率模拟的最佳替代方案↑ NCEP-CFSR 再分析或 NCEP-GFS 分析数据可以作为 WRF 波能评估的替代方案↑ 所有数据库的一个共同特点是,它们都高估了低风速而低估了强风↑ 空间分辨率对结果的影响↑ 本研究中提供的结论和结果可以放心地考虑到其他地区,特别是沿海地区;
↑ 洋面风的价值:建模、风能↑ 卫星数据的缺点
Abstract
Offshore wind data derived from the below were compared to in situ measurements, in order to assess which one of these products is the best alternative to in situ offshore measured wind data.
- satellite measurements (CCMP, QuikSCAT, NCDC Blended Sea Winds and IFREMER Blended Wind Fields),
- reanalyses (NCEP-CFSR, ERA-Interim, NASA-MERRA and NCEP-RII),
- analyses (NCEP-FNL and NCEP-GFS),
- WRF modelled
Wind speed and direction from these products were compared to measurements collected at five buoys moored along the Iberian Peninsula Atlantic coast.
↑ 四种数据:卫星、再分析、分析、WRF model,good
Results show that
WRF modelled offshore winds are the best alternative to in situ measured offshore wind data, showing the highest temporal accuracy (the ability in representing the wind speed and direction at a given time instant) and lowest errors in terms of offshore wind power flux estimations.
However, offshore wind data taken from CCMP shows the lowest errors in terms of the mean wind speeds and, together with IFREMER-BWF, the best wind temporal accuracy after WRF simulation.
Therefore, in general CCMP and IFREMER-BWF can be considered as the best alternatives to WRF high resolution modelled offshore winds, if the latter is not available.
Specifically for offshore wind energy resource assessment, NCEP-CFSR reanalysis or NCEP-GFS analysis data can also be used with confidence as an alternative to WRF modelled data, showing better wind power flux estimates than CCMP and IFREMER-BWF.
↑ WRF 模拟的海上风是现场测量海上风数据的最佳替代方案
↑ CCMP 和 IFREMER-BWF 可以被认为是 WRF 高分辨率模拟的最佳替代方案
↑ NCEP-CFSR 再分析或 NCEP-GFS 分析数据可以作为 WRF 波能评估的替代方案
Despite the best performances of WRF high resolution offshore winds, such modelling tasks require considerable computational resources and time to obtain quality results. Therefore, the value of satellite-derived wind data should not be disregarded. These remotely sensed offshore wind measurements should be seriously considered when searching for alternative sources of wind information for ocean areas, in particular for open ocean areas where they have their strength.
↑ 不应忽视卫星风数据的价值。在为海洋区域寻找替代的风信息来源时,应认真考虑这些遥感海上风测量,
Acknowledgement
D. Carvalho was supported by the Portuguese Foundation for Science and Technology (F.C.T.) Ph.D grant SFRH/BD/73070/2010. This work was partially financed by Xunta de Galicia under the project “Programa de Consolidación e Estructuración de Unidades de Investigación Competitivas (Grupos de Referencia Competitiva)”, co-funded by the European Regional Development Fund (FEDER). The authors would like to express their gratitude to all the climate, meteorological and oceanographic institutions referred in the text, for providing the data used in this work.
4 Conclusions
This study evaluates and compares offshore wind data derived from satellites (Cross-Calibrated Multi-Platform ocean wind vectors, QuikSCAT scaterometter, NCDC Blended Sea Winds and IFREMER Blended Wind Fields), reanalyses (NCEP-CFSR, ERA-Interim, NASA-MERRA and NCEP-RII), analyses (NCEP-FNL and NCEP-GFS) and WRF modelled offshore winds, aiming to determine which one of these databases offers the offshore wind data closest to measurements collected by buoys moored offshore the Iberian Peninsula Atlantic coast. The findings presented here can be of great value for climate, oceanic, meteorological and offshore wind energy resource assessment applications that focus on ocean areas where in situ measured wind data is either not available or is insufficient and, therefore, alternative sources of offshore wind data have to be considered.
The results presented in this study show that WRF offshore wind simulation is the best alternative source to in situ measured offshore wind data, showing the highest temporal accuracy (RMSE, STDE and correlation coefficients) and offshore wind power flux estimations. However, offshore wind data taken from CCMP database shows the lowest errors in terms of the mean wind speeds (biases and mean wind speed) and, together with IFREMER-BWF, a temporal accuracy similar to the WRF simulation. Therefore, in general CCMP and IFREMER-BWF can be seen as the best alternatives to WRF high resolution modelled offshore winds, if such results are unavailable. Specifically for offshore wind energy resource assessment, NCEP-CFSR reanalysis and NCEP-GFS analysis data can also be used with confidence as alternative to WRF modelled data, with better performances than CCMP and IFREMER-BWF.
While WRF, QuikSCAT, NCDC-BWF, IFREMER-BWF, ERA-Interim, NCEP-RII and NCEP-FNL show a tendency to overestimate the wind speeds and wind power fluxes estimates, NASA-MERRA shows an opposite tendency. CCMP, NCEP-CFSR and NCEP-GFS do not seem to have any tendency to over/underestimate wind velocities and wind power fluxes estimates (except CCMP, which seems to systematically underestimate the wind power fluxes). A common feature to all databases is that all of them overestimate low wind speeds and underestimate strong winds (except QuikSCAT, which sows an overestimation tendency transversal to all wind velocities magnitudes). The best performances are usually obtained in the presence of intermediate wind speeds (4–12 m·s<sup>−1</sup> ).
↑ 所有数据库的一个共同特点是,它们都高估了低风速而低估了强风
Spatial resolution seems to have an important impact on the databases accuracy.
- The ones with finer spatial resolution are typically the ones with the best results (with some exceptions such as NASA-MERRA and NCDC-BSW). Since the in situ data here used is strongly influenced by the neighbouring topography, terrain characteristics and land-sea discontinuities, products with finer spatial resolutions are more likely to attain better performances.
- Although satellite-derived winds have finer spatial resolutions when compared to reanalysis and analysis products, they suffer from land masking issues that limit their accuracy in retrieving coastal winds.
↑ 空间分辨率对结果的影响
Temporal sampling rate does not seem to have such an impact, at least in what is related to the ability to represent local wind speed distributions (although it is advisable to use databases with at least 6-hourly records). However, temporal resolution of the wind products is an important characteristic in terms of the ability to accurately represent local wind circulation patterns.
↑ 时间采样率
Although the advantages in using mesoscale NWP models for high resolution offshore wind modelling are shown in this study, such tasks require considerable computational resources and time to obtain quality results. Moreover, it is known that satellite-derived wind data has its strength in open ocean areas. Therefore, the value of satellitederived wind data cannot be disregarded, and these kinds of offshore wind data sources have to be seriously considered when searching for alternative sources of wind information in particular for wide ocean areas.
Since the buoys considered in this study are distributed through a wide geographical area, where each buoy shows its own local wind micro-climate, the conclusions and findings provided in this study can be considered with confidence for other areas, in particular coastal ones.
↑ 本研究中提供的结论和结果可以放心地考虑到其他地区,特别是沿海地区
1 Introduction
Climatic, atmospheric and oceanic modelling applications require accurate oceanic surface wind data to, realistically, represent the oceanic forcing fields and interactions between air and sea. Moreover, data regarding ocean winds is very valuable in the context of offshore wind energy, which is expected to constitute a significant part of the future wind-derived energy as a whole (Carvalho, Rocha, Gómez-Gesteira, & Santos, 2012; Carvalho, Rocha, Santos, & Pereira, 2013).
↑ 洋面风的价值:建模、风能
However, it is known that ocean areas suffer form a strong lack of measured wind data, mainly due to the high costs and technological challenges involved in the installation of wind measuring masts at such sites. Even when in situ data exists (collected on board ships, vessels, moored buoys, etc.) their availability is highly variable both in space and time and cannot be considered as representative of local wind regimes (Risien & Chelton, 2006). Especially for offshore wind resource assessment applications, accurate wind data is a key factor because energetic production is proportional to the wind speed cubed (Bruun, Koch, Horstmann, Hasager, & Nielsen, 2006), making that apparent small inaccuracies in the wind velocity can originate large discrepancies in the expected wind-derived energy production.
↑ 海洋区域严重缺乏测风数据:高成本和技术挑战
Thus, it becomes paramount to search and validate alternative data sources to in situ measured wind data over ocean areas. These alternative sources of offshore wind data consist, basically, in satellite-derived measurements, data simulated by numerical weather prediction (NWP) models and products that combine observed and NWP simulated data (mainly reanalysis and analysis datasets).
↑ 四种数据:卫星、再分析、分析、WRF model,good
While satellite-derived wind data is available at a near-global scale and in a time-continuous way, they are indirect measurements (that is, they are derived from other measurements and processed using complex geophysical models) and often suffer from low spatial and/or temporal resolutions, together with large missing/erroneous data gaps (data records affected by rain, malfunction of instruments, etc.).
↑ 卫星数据的缺点:间接测量+受到低分辨率的影响+数据缺失问题NWP models, in particular regional circulation models (RCMs, also known as mesoscale models), are able to produce meteorological data at high spatial and temporal resolutions for any area of the globe, and in a relatively fast way (depending on the available computational resources, NWP model configuration, desired resolutions and spatial/time coverage). In the recent past, NWP modelling has found a number of applications focused on deriving wind information to study meteorological and climatic events, drive oceanic models and in the preliminary search and identification of potential sites for wind energy exploitation. However, NWP modelled wind data usually shows non-negligible deviations when compared to observed data, mainly due to their inability in accurately resolving medium- to small scale meteorological processes (Carvalho, Rocha, Gómez-Gesteira, & Silva Santos, 2014).
↑ NWP 研究气象和气候事件、驱动海洋模型以及初步搜索和确定风能开发的潜在地点Reanalysis and analysis products combine data simulated by global circulation models (GCMs) with large amounts of meteorological measurements, providing a complete and homogeneous synthesis of the available global observations assimilated into a continuous and coherent physical structure (Trenberth et al., 2010). However, these kinds of products are usually available at low spatial resolutions (250 to 50 km), insufficient to accurately characterize local wind regimes and adequately represent medium and small scale meteorological features.
The aim of this study is to evaluate and compare several alternative sources of offshore wind data with in situ ocean surface wind measurements, with the main objective of determining which of these alternative offshore wind sources best describe the local wind regimes at the selected buoy locations and, thus, can be considered as the best alternative to in situ measured offshore wind data. For this, one complete year of satellite-derived wind data, NWP modeled and reanalysis/analysis products are compared with in situ offshore wind measurements collected by five buoys moored offshore the Iberian Peninsula Atlantic coast (Gulf of Cádiz, West and North Galician coast).
- The NWP chosen to run the offshore wind simulation for the area under study is the Weather Research and Forecasting (WRF) mesoscale model.
- The sources of satellite-derived offshore wind data used in this study are: NASA’s SeaWinds scatterometer installed onboard the QuikSCAT satellite platform (henceforth referred to as QuikSCAT); the National Climatic Data Center Blended Sea Winds (NCDC-BSW); the French Research Institute for Exploitation of the Sea Blended Wind Fields (IFREMER-BWF); and the Cross-Calibrated Multi-Platform Ocean Surface Wind Vectors (CCMP).
- The reanalyses and analyses considered in this study are: the National Centres for Environmental Prediction Reanalysis 2 (NCEP-R2); the European Centre for Medium-Range Weather Forecasts (ECMWF) Interim reanalysis (ERA-Interim); the National Centre for Environmental Prediction Climate Forecast System Reanalysis (NCEP-CFSR); NASA’s Modern Era Retrospective Analysis for Research and Applications (NASA-MERRA); the National Centre for Environmental Prediction Global Forecast System (NCEP-GFS) and the National Centre for Environmental Prediction Final Analysis (NCEP-FNL).
The main characteristics of all these sources of offshore wind data are presented in Table 1, and in Sections 2.1, 2.2 and 2.3 additional information about these datasets are presented.

The published literature includes several studies that
- compare NWP offshore wind simulations with observations (eg.: Berge, Byrkjedal, Ydersbond, & Kindler, 2009; Carvalho, Rocha, & Gómez-Gesteira, 2012; Carvalho, Rocha, Gómez-Gesteira, & Silva Santos, in press-a,b; Jiménez, Durante, Lange, Kreutzer, & Tambke, 2007; Ohsawa et al., 2007; Shimada & Ohsawa, 2011; Shimada, Ohsawa, & Yatsu, 2009),
- or that compare satellite-derived offshore winds with buoy measurements (eg.: Ebuchi, Graber, & Caruso, 2002; Moore, Pickart, & Renfrew, 2008; Pensieri, Bozzano, & Schiano, 2010; Pickett, Tang, Rosenfeld, & Wash, 2003; Sánchez et al., 2007; Satheesan, Sarkar, Parekh, Ramesh Kumar, & Kuroda, 2007; Tang, Liu, & Stiles, 2004).
- Also studies that compare satellite-derived, reanalyses, and/or blended satellite-derived offshore winds with measurements are available (eg.: Kent, Fangohr, & Berry, 2013; Li et al., 2013; Ruti, Marullo, D’Ortenzio, & Tremant, 2008),
- as well as studies that focus on the comparison of NWP and satellitederived offshore winds with observations (eg.: Accadia, Zecchetto, Lavagnini, & Speranza, 2007; Karagali et al., 2013; Wallcraft et al., 2009).
From these studies there are evidences that products that combine satellite and NWP data, and in particular CCMP, can offer improvements when compared to individual satellite records.
↑
However, satellite-derived records are usually more accurate than reanalyses/analyses.
↑
Furthermore, NWP-derived data, in particular the ones obtained with mesoscale NWP models, seems to show better performance in terms of wind variability but higher biases when compared to satellitederived winds.
↑
In particular for the area here under study, the following studies should be highlighted:
- Penabad et al. (2008) compared 4 years (2002–2005) of QuikSCAT and two NWP (MM5 and ARPS) modelled winds with measured wind data collected offshore the Galician Coast, concluding that no significant differences between models and satellite data were found.
- Otero and Ruiz-Vilarreal (2008) evaluated the reliability of different meteorological models through the comparison with observed winds around the north-west and north Iberia during autumn 2002 showing significant differences among modeled wind data products.
- Carvalho, Rocha, Gómez-Gesteira, Alvarez, and Silva Santos (2013) compared 3 different QuikSCAT products (gridded L3 and swath L2B with 25 and 12.5 km) and CCMP with measured winds collected in the same buoys considered in this study, for the same time period (2008), concluding that the high resolution QuikSCAT L2B product showed the best results for the wind speed variability and wind direction means, while CCMP showed the best results for wind speed means and wind direction variability.
- Alvarez, Gomez-Gesteira, deCastro, and Carvalho (2013) compared 10 years (2000–2009) of wind data from six databases (NCEP-R2, ERA-Interim, NASA-MERRA, NCEP-CFSR, QuikSCAT and CCMP) with wind measurements collected by four buoys moored in the southern limit of the Bay of Biscay, concluding that the wind products with finer spatial resolution provide the best results, especially in nearshore areas.
- Sousa, Alvarez, Vaz, Gomez-Gesteira, and Dias (2013) evaluated 1 year of QuikSCAT and WRF modelled winds with in situ measurements collected by three buoys moored offshore the Galician coast, reporting that the wind speeds derived from QuikSCAT and WRF do not show significant differences along the coast.
Despite all of this research, no study was found that makes a joint comparison of all these sources of offshore wind data, objectively assessing through an integrated comparison which one of these products is the best alternative to in situ offshore wind measurements, nor for the area here under study nor for any other areas of the globe. Such findings can be of great value for areas where no in situ offshore measured data are available (or the available data is insufficient and/or inadequate for the desired purposes) and, therefore, valid alternatives have to be found. This is the case for the area under study, since the Iberian Peninsula is presently one of the areas with the highest percentage of installed onshore wind power per capita worldwide due to its attractive wind conditions. This asset, combined with its large coastal line, makes this area a promising one for future installation of offshore wind farms.
↑
待了解:钟老师文献管理方法
web of science
检索式(比较难确定关键词)
数据融合:
- data fusion, data integration, data syncretizing(有道翻译)
- sensor fusion,information fusion, fused data (wiki)
海表面风,洋面风,海浪:wind or wave,

标记结果列表

创建跟踪服务(可选)
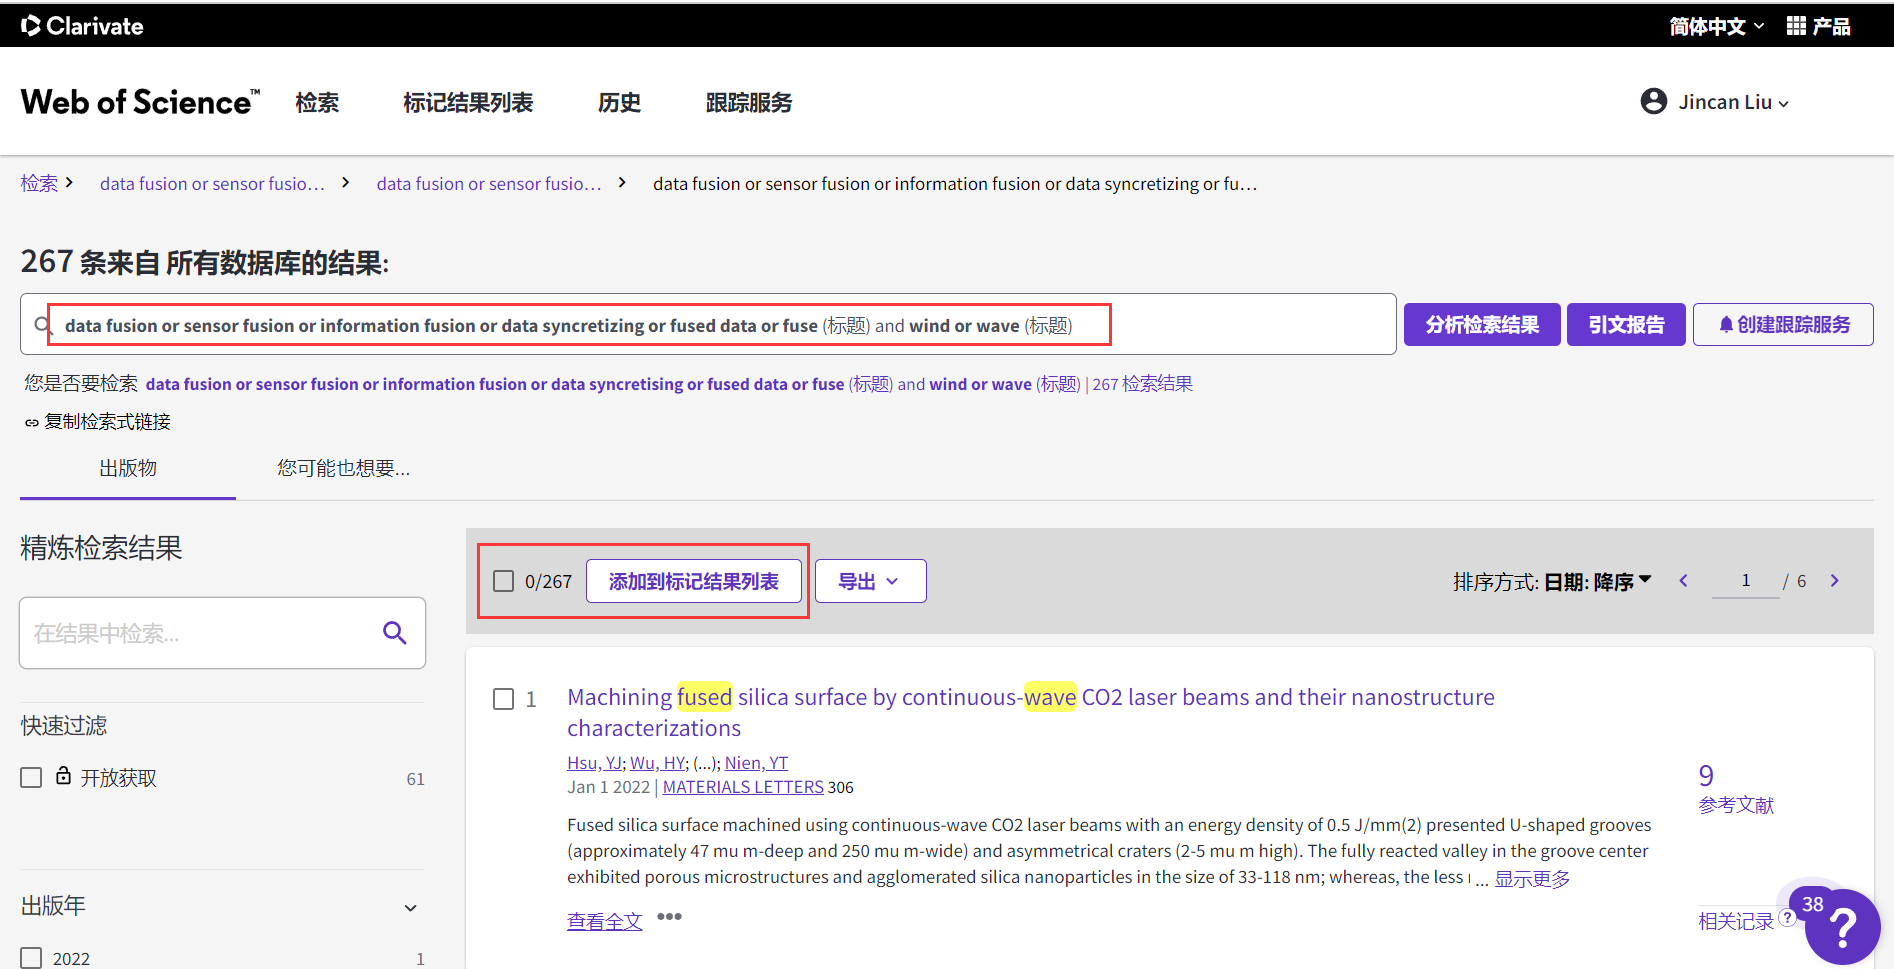
导出到endnote
首先需要在所选文件夹下新建保存endnote数据的文件夹
具体导出操作
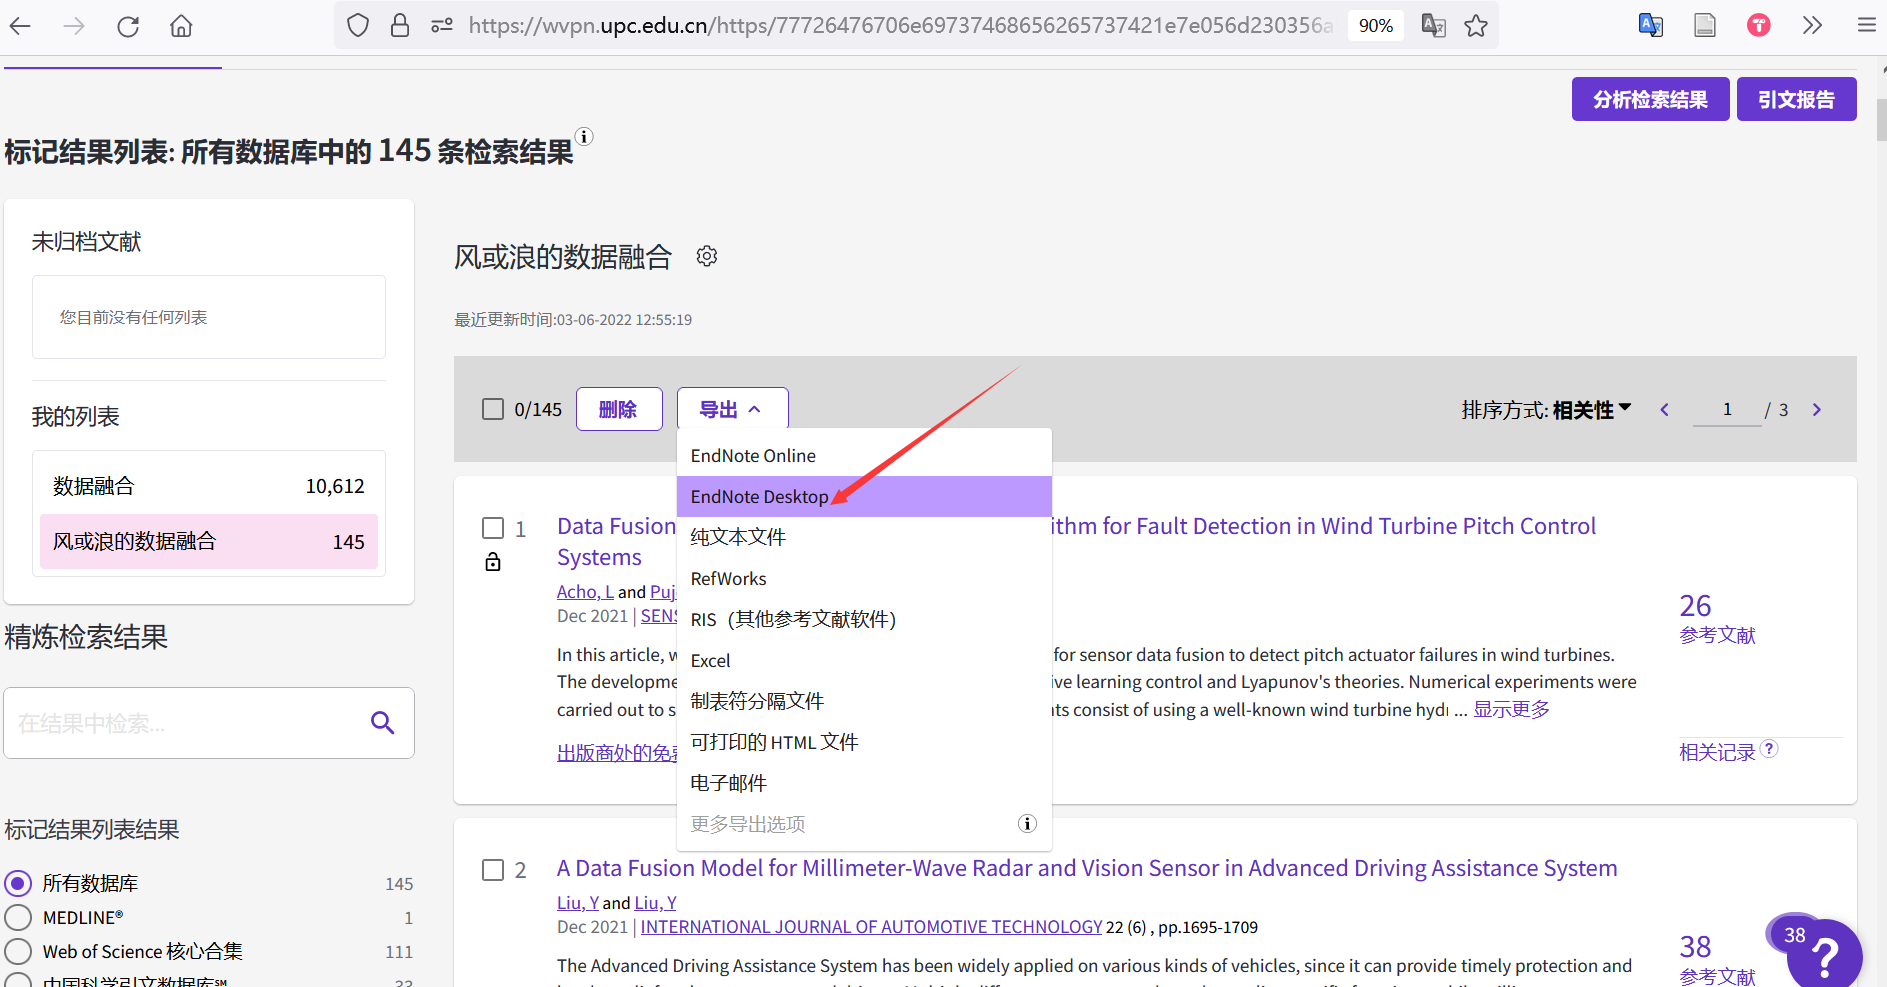
双击生成的文件,就会导入到正在打开的endnote了

endnote
清除重复的文献

bottom
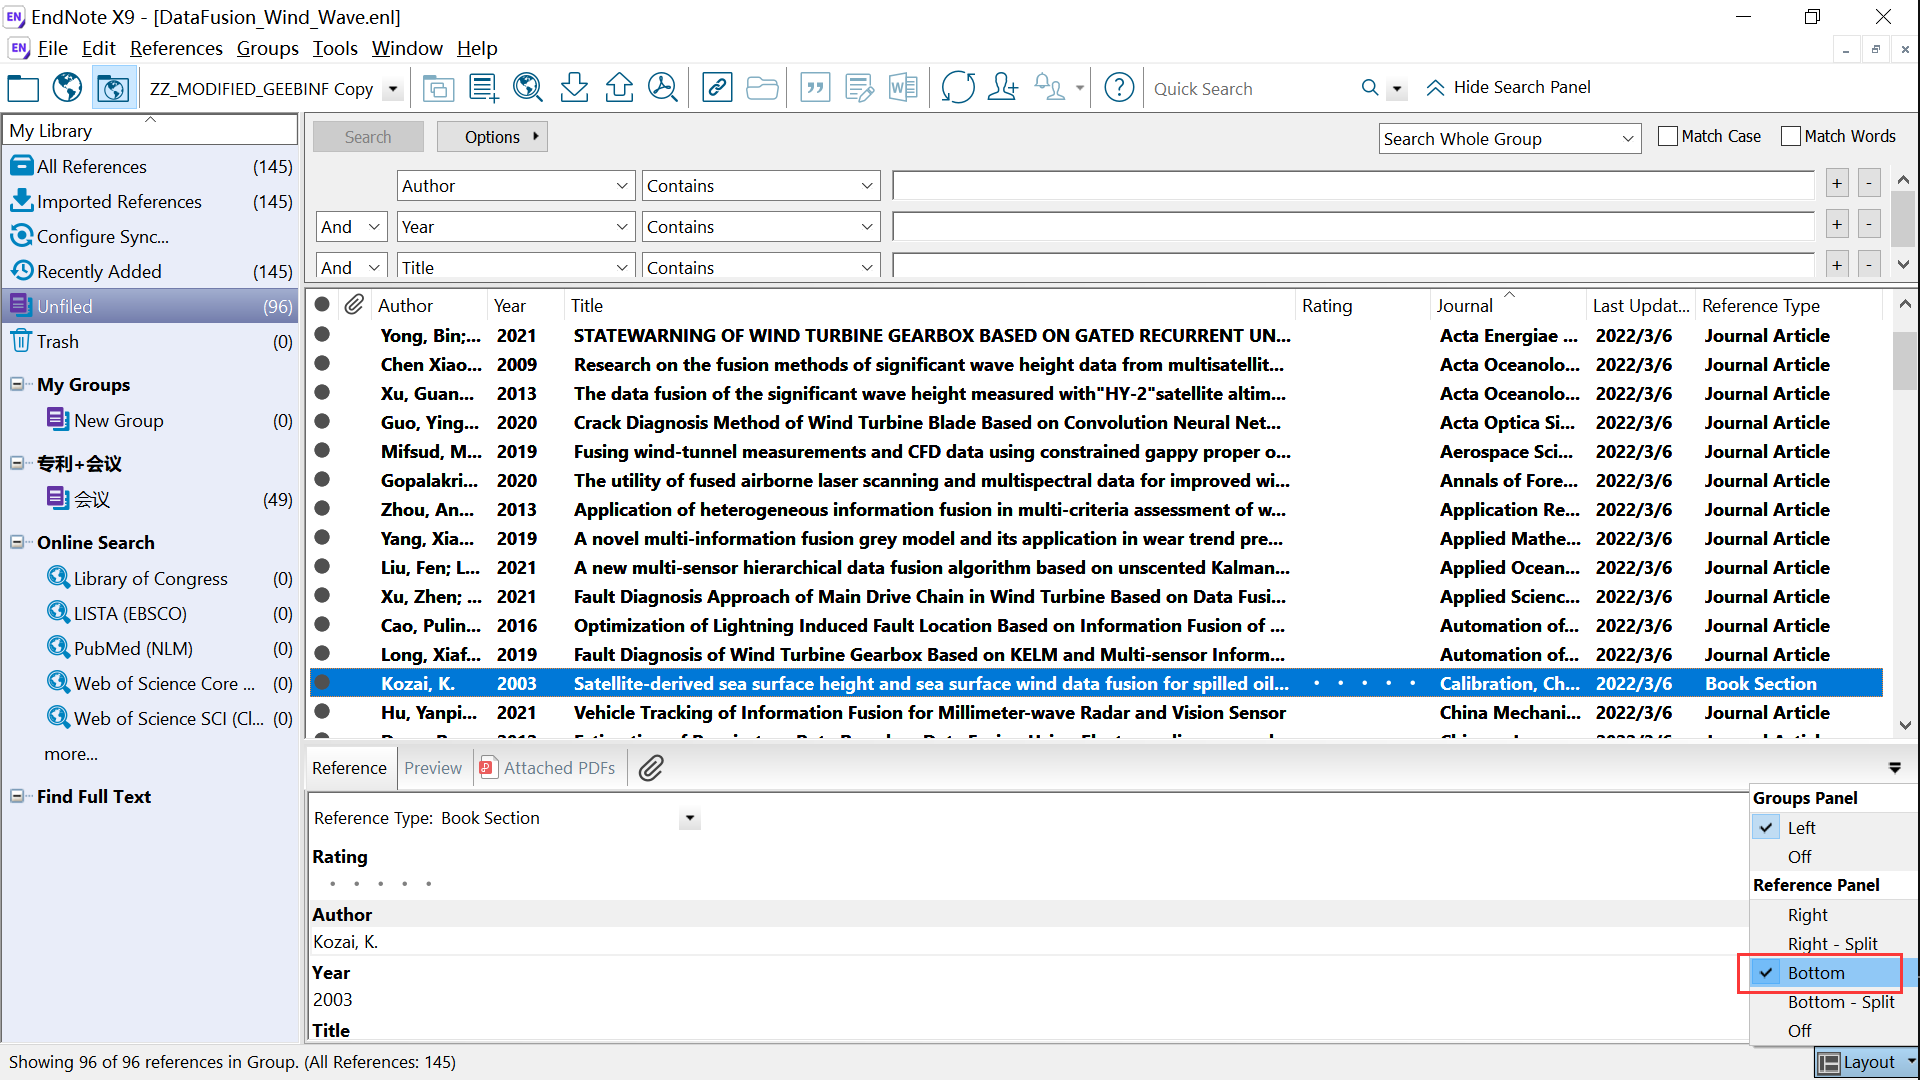
分类;
2022-03-07 wjc老师讨论
指标要求是什么?
洋面风量化指标:
查询 10km,三角形网格,平均 10km;(港珠澳大桥,很细,桥墩~)
同化前三天的数据,再往前的数据影响就不大了;
融合的话,变分分析,二维变分
三维变分(二维变分+时间动力插值~动力约束下的二维变分),时间上前后的差分;全球 10km,区域 5km,时间 3小时;
模式三角形网格,反插值成正常网格;
分辨率 12.5 km,
方法是软东西,产品是真东西()
指标要求:三角形网格,平均 10km,3 小时
补充资料1.docx
9.2.4 技术路线
9.2.4.1 设计策略
9.2.4.2 关键技术
9.2.5 模块设计
海表气象要素融合实况分析子系统包含洋面风多源融合实况分析产品及历史产品、海浪多源融合实况分析产品、海表温度多源融合实况分析产品及历史产品、海洋降水融合实况分析产品及历史产品、海上气温融合实况分析产品等5个部分功能建设,各部分模块设计如下:~~
什么是横向和纵向项目?
横向-层次相同的单位(要求没这么高),纵向-更高一级的单位(),
什么是数据融合?
高度计-线状-SWH,数据量相对少,
散射计-带状-~~,数据量相对多,
新的方法:二维变分+动力插值,
混合海风资料?
遥感数据资料?
关于融合的科学技术报告?
CCMP,
ERA5,
查、查、查~~
融合的翻译?
blending,(混合)
fusion,(融合)
各个产品是什么?
再分析产品,(??)
同化产品,
融合产品,(更宽泛)
上传的文献内容是什么?
风场网格化
二位变分分析,
CCMP 怎么做的,三位变分,
CWIND 技术报告,
2022-03-07 wjc老师反馈
老师发送的资料
混合海风 https://www.ncei.noaa.gov/products/blended-sea-winds
资料1-20220307.docx
重要!!!!星载散射计的研究现状及发展趋势.pdf
2.多源气象数据融合产品原型系统开发技术报告--wjc.docxsHigh-resolution ASCAT wind vector data set gridded by applying.pdf
Gridded surface wind fields from Metop-ASCAT measurements.pdf
A Two-Dimensional Variational Analysis Method for NSCAT Ambiguity Removal Methodology, Sensitivity, and Tuning.pdf
中国风云卫星与海洋卫星近海SST资料融合技术及应用研究_苗春生.pdf
CCMP2.0.pdf
各种风场数据说明.doc
4.(以此为蓝本写实施方案)mwf_vol1.pdf3. (以此为技术蓝本)SeawindsDocumentation.pdfwork–deadline 2022-03-08 晚上,最迟 2022-03-09 早上
历史数据回算模块:历史回算模块主要分为单点时间历史数据回算、多点时间历史数据回算、单一连续时间段历史数据回算、混合时间设置历史数据回算。通过配置输入数据(岸基观测洋面风、各种海洋气象卫星及海基观测等)、数据产品目录、回算时次信息后,可实现一键式回算。同时实现历史数据集的制作。(刘锦灿)
海洋卫星高度计产品预处理模块:(刘锦灿)
海洋卫星波谱仪产品预处理模块:(刘锦灿)
海基海浪观测预处理模块:基于大数据云平台实现海浪融合中需要浮标、船舶、海上平台等多种海浪实际观测数据的获取,并按照融合模块要求,将实际观测数据输出。同时实现历史数据的预处理,达到历史数据集制作要求。(刘锦灿)
卫星反演海浪产品数据检查模块:根据产品质量控制码挑选质量可靠的数据;再根据融合产品区域的海陆分布,剔除陆上格点、海陆混合格点及距离陆地较近格点的数据,将陆地对探测数据的影响降到最低;然后结合所用背景场数据,进行融合前的背景场差异检查,剔除差异明显超出部分的数据,最后梳理成待融合的高质量数据。同时实现历史数据的检查,达到历史数据集制作要求。(刘锦灿)
历史数据回算模块:历史回算模块主要分为单点时间历史数据回算、多点时间历史数据回算、单一连续时间段历史数据回算、混合时间设置历史数据回算。通过配置输入数据(岸基观测海浪产品、海洋卫星及海基观测数据)、数据产品目录、回算时次信息后,可实现一键式回算,实现历史数据集的制作。(刘锦灿)
海洋卫星高度计产品预处理模块:(刘锦灿)
要求:
实现海浪融合中需要海洋卫星海浪产品的预处理,包括输入数据文件中
- 特定变量的投影转换、
- 分辨率转换
QT:需要哪些海洋卫星?
海洋一号C卫星(HY-1C)数据、海洋二号A卫星(HY-2A)数据、海洋二号B卫星(HY-2B)数据、
海洋二号C卫星(HY-2C)数据、
中法海洋卫星(CFOSAT)数据、高分卫星数据

QT:HY-2B获取数据中级别选项是什么意思?
选择SDR吧~No,应该是GDR
对国家卫星海洋中心提供的HY-2B和HY-2C海洋卫星雷达高度计(ALT)二级产品数据GDR_L2R,进行预处理:
QT:海洋卫星的产品数据格式?
QT:需要哪些海浪产品?
QT:
实现与融合模块的对接,保证融合质量。
同时实现历史数据的预处理,达到历史数据集制作要求。
阅读7:星载微波散射计的研究现状及发展趋势.pdf-2009
摘要
本文
- 介绍美国宇航局(NASA)和欧空局(ESA)星载微波散射计传感器的类别和特点以及发展历程,
- 详细描述星载散 射计海面风矢量在大洋环流、海洋大气交互作用、中短期极端天气状况预报等领域的应用以及散射计分辨率增强数据在极地海 冰制图、监测、分类、陆地植被参数反演等方面的应用,
- 展望星载散射计研究在全天候、全天时、高时间分辨率、高空间分辨 率等提高观测能力方向的发展趋势,
- 最后简述国内星载散射计神州 4 号(SZ-4)散射计(CN/SCAT)和海洋卫星 2 (HY-2)号散射计的特点及研究现状。
2 散射计探测原理
3 散射计观测计划
散射计扫描方式
笔形波束散射计相较于扇形波束散射计的优势
NASA和ESA对波段选取
过去、现役和未来的散射计观测计划
现役 Seawinds 和 ASCAT 散射计的技术参数以供参考
4 散射计应用研究
- 海面风场应用
- 海冰制图与监测
- 陆面应用研究
5 散射计研究发展趋势
- 美国全国研究理事会(NRC)制定了空间技术应用于地球科学的十年规划,其中,对散射计未来的发展提出三个计划
6 国内散射计研究现状
- **我国第一个多模态微波遥感器(M3RS)**于 2002 年 12 月,由 sz-4 送入太空
- HY-2 散射计性能技术参数
阅读8:卫星高度计及其应用-1989
一、星载高度计-ATL
二、海面高度测量
三、应用
- 卫星的点轨迹
阅读9:多源卫星高度计新融合产品的研发与评估-2020
摘要
- 当前在轨运行的高度计卫星已达5颗(Sentinel-3A、Jason-3、Cryosat-2、Saral/AltiKa以及HY-2A), 观测精度不断提高, 但卫星高度计融合产品的有效分辨率(可分辨海面涡旋的最小尺度)仍需进一步提升.
- 本研究以变分原理为基础, 改进背景场、背景误差协方差矩阵以及观测误差, 建立一种新的多源卫星高度计资料融合方法.
- 以南海及其附近海域为目标区域, 在格距为0.08°的规则网格上, 融合所有在轨运行的5颗卫星高度计的沿轨数据, 得到逐日融合产品.
- 评估分析表明: 新方法得到的融合产品的有效分辨率达到125 km左右, 与国际上广泛应用的AVISO产品相比(格距0.25°, 有效分辨率240 km), 有效分辨率提高近一倍, 融合产品的精度进一步提高, 可用于描述更小尺度的海洋环流结构.
引言
卫星高度计在运行中获取沿轨星下点的海面高度(sea surface height, SSH),
法国建立的多源卫星高度计资料融合产品AVISO(archiving, validation, and interpretation of satellite oceanographic data),
AVISO在南海的有效分辨率仅为240 km,
3 融合产品评估
- 采用滤波后的J3和S3A沿轨资料(以下简称沿轨资料)作为观测真值[22], 确定有效分辨率及误差
- AMSR2卫星观测的海表温度(sea surface temperature, SST)[23]和NOAA提供的南海洋面漂流浮标资料[24], 考查融合产品的合理性.
阅读10:“海洋二号”有效波高数据在多源卫星高度计数据融合中的应用-2013
摘要
- 利用反距离加权法根据不同的方案融合
- 借助NDBC提供的浮标数据对融合结果进行验证和比较
1 引言
- 海洋二号的介绍
2 数据资料以及数据预处理
融合的高度计资料包括:“HY-2”、“Jason-1/2”以及“ENVISAT”卫星高度计
国家海洋局国家卫星海洋应用中心提供的“HY-2”数据、NASA提供的“Jason-1/2”数据、以及ESA提供的“ENVISAT”数据
各卫星高度计的主要参数
各卫星高度计的轨道分布
各卫星高度计的使用手册:
- 进行质量控制,
- 去除陆地和冰上的数据以及质量不符合要求的数据
AVISO,PODAAC.AVISO and PODAAC User Handbook-IGDR and GDR Jason-1Products,2008[EB/OL].[2011-04-23].http://www.aviso.oceanobs.com/fileadmin/documentsdatatools/hdbk_j1_gdr.pdf.
OSTM/Jason-2Products Handbook,2009[EB/OL].[2011-05-10].http://www.aviso.oceanobs.com/fileadmin/documents/data/tools/hd-bk_j2.pdf.
ESA.ENVISAT-1Products Specifications Volume 5:Products Structures,2007[EB/OL].[2011-06-03].http://earth.esa.int/pub/ESA_DOC/ENVISAT/Vol05_Structures_3d_20071122.pdf.
ESA.ENVISAT-1Products Specifications Volume 14:RA-2Products Specifications,2008[EB/OL].[2011-06-03].http://earth.esa.int/pu-bESA_DOC/ENVISAT/Voll4_Ra2mwr_4B.pdf.
ESA.ENVISAT RA2/MWR Product Handbook,2007[EB/OL].[2011-06-03].http://envisat.esa.int/pub/ESA_DOC/ENVISAT/RA2_MWR/ra2-mwr.roductHandbook.2_2.pdf.
对各卫星高度计数据进行校准
轨道交叉点处的精度
阅读11:remss.com/missions/ssmi/~~卫星融合模板
CCMP 中对 SSMI / SSMIS 卫星的融合 https://www.remss.com/missions/ssmi/
介绍
Special Sensor Microwave Imager (SSM/I) 和 Special Sensor Microwave Imager Sounder (SSMIS) 是卫星无源微波辐射计。自 1987 年以来,这一系列仪器已搭载在国防气象卫星计划 (DMSP) 卫星上。这些是近极地轨道卫星。这些仪器以 F08 开头的卫星编号表示,并在下表中列出。目前运行的仪表有:F15、F16、F17和F18。我们从辐射计观测中获得的海洋测量结果包括地表风速、大气水汽、云液态水和降雨率。
仪器说明
数据处理
遥感系统分两个阶段对 SSM/I 和 SSMIS 仪器数据进行详细处理。第一阶段产生一个临时产品(在文件名中用“rt”标识),我们会尽快提供它,通常在记录数据后的几个小时内。本产品可能不完整或包含提供给我们的数据中固有的地理定位错误和错误的亮度温度。这些错误在最终处理中被消除,通常在初始产品的几天内完成。最终产品会自动替换中间产品,文件名中的“rt”名称更改为“v7”。
阅读12:我国海洋卫星数据应用发展现状与思考-2021-02
本文总结了国内外海洋卫星的基本情况和我国海洋卫星数据应用发展的现状,在此基础上提出我国海洋卫星数据应用发展中存在的主要问题,以及未来的发展策略。
1 国内外海洋卫星资源基本情况
海洋卫星主要类别
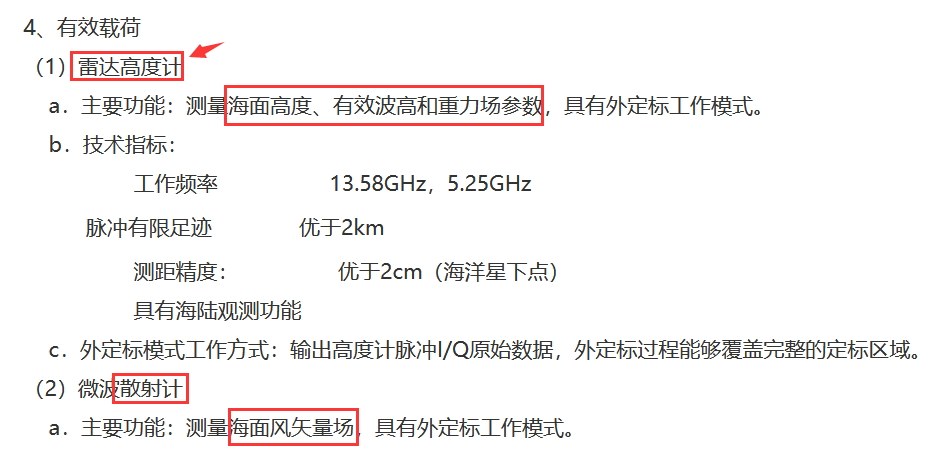
- 海洋水色卫星是对海洋水色要素(如叶绿素、悬浮沙和可溶性的有色有机物质等)和水温及其动态变化的探测
- 海洋动力环境卫星是对海洋风场、海面高度、浪场、流场以及温度场等动力环境要素探测的卫星(林明森等,2018),有效载荷通常是微波散射计、微波辐射计、雷达高度计等,并具有多种模式和多种分辨率。
- 海洋综合探测卫星是对全球与近海(包括海岸带)海洋动力环境和生态环境各种信息的综合遥感监测,同时具备多种载荷。
国外海洋卫星发展现状
我国海洋卫星发展现状
包括海洋2号系列卫星、中法海洋卫星与海风海浪卫星和海洋盐度卫星。
海洋2号系列卫星以海面风场、高度、温度等动力环境要素为探测对象。
2025年前的发展包括3个阶段:第一阶段为海洋2A卫星;第二阶段为海洋2B/C/D卫星;第三阶段为新一代海洋动力环境卫星。
中法海洋卫星(China-France Oceanographic Satellite,CFOSAT)
海风海浪卫星是中法海洋卫星的后续星。国家卫星海洋应用中心于2017年底启动了该星立项论证工作。
阅读13:我国海洋卫星发展历程、现状与建议-2021-09
一、海洋卫星需求背景
二、海洋卫星规划、型号立项与各阶段成果
三、目前在轨海洋卫星用途与特点
- 从2002年5月15日发射第一颗海洋卫星至今,已经发射了10颗海洋卫星,包括HY-1A/1B/1C/1D、HY-2A/2B/2C/2D、CFOSAT、GF-3卫星,目前HY-1A/1B已经停止工作,HY-2A降级工作,其余卫星在轨正常工作。
- 在轨海洋卫星用途
- 海洋二号系列卫星用于全球全天候海面风场、浪高、海面高度、海面温度等多种海洋动力环境参数监测,直接为灾害性海况预警预报提供实测数据,为海洋防灾减灾、海洋权益维护、海洋资源开发、海洋环境保护、海洋科学研究以及国防建设等提供支撑服务,载荷为雷达高度计、微波散射计、微波辐射计、双频全球定位系统、船舶自动识别系统、数据收集系统、双向数据通信等,HY-2A为试验星,HY-2B/2C/2D三星实现业务化组网观测。
- 国际合作试验卫星:CFOSAT为中法两国合作的科研试验卫星,中方提供散射计,法方提供波谱仪,主要任务是获取全球海面波浪谱、海面风场、南北极海冰信息,进一步加强对海洋动力环境变化规律的科学认知
- 卫星载荷配置、轨道与工作模式
- 海洋卫星可兼顾大尺度陆地监测,为快速普查与应急救灾提供支撑
阅读14:国家卫星海洋中心
海洋卫星
http://www.nsoas.org.cn/news/content/2018-11/23/44_697.html

HY-2B
数据服务
海洋动力环境卫星数据的数据获取
数据说明文档及软件下载
HY-2B卫星数据使用说明.pdf
- 2 级产品数据分为
- 实时业务化地球物理数据(Operational Geophysical data record, 以下简称:OGDR)
- 临时地球物理数据(Interim Geophysical Data Records, 以下简称:IGDR)、
- 遥感地球物理数据(Sensor Geophysical Data Records, 以下简称:SGDR)、
- 地球物理数据(Geophysical Data Records, 以下简称:GDR)四种产品。
- 其中,校正微波辐射计数据产品已经整合到雷达高度计标准数据产品中,不再单独介绍。
HY-2B卫星高度计二级产品数据格式说明.pdf
国家卫星海洋应用中心将载荷的 HY-2 卫星高度计 0 级数据经过预处理、数据反演和统计平均分别生成 1 级、2 级和融合数据产品。按照国际惯例,0 级和1 级产品为原始数据产品,不对外分发。
SGDR与IGDR和GDR基本一致,区别在于其中包含了波形数据
数据产品制作流程(二级数据处理得到的数据称为二级产品)

海洋卫星波谱仪产品预处理模块:(刘锦灿)
阅读:地理信息系统中多种投影转换的实现-1996
海基海浪观测预处理模块:(刘锦灿)
要求:
- 基于大数据云平台实现海浪融合中需要浮标、船舶、海上平台等多种海浪实际观测数据的获取,
- 并按照融合模块要求,将实际观测数据输出。
- 同时实现历史数据的预处理,达到历史数据集制作要求。
阅读:Argo
阅读:基于Argo浮标观测数据的海洋温、盐度特征分析-2021
Argo 是温盐的
阅读:ICOADS资料
Data and Documentation

IMMA1 documentation
R3.0-imma1_short.pdf
阅读:西北太平洋海浪现场观测及统计产品数据集-2021-~~ICOADS+观测数据质量控制
ICOADS介绍
观测资料的质量控制
卫星反演海浪产品数据检查模块:(刘锦灿)
要求:
- 根据产品质量控制码挑选质量可靠的数据;
- 再根据融合产品区域的海陆分布,剔除陆上格点、海陆混合格点及距离陆地较近格点的数据,将陆地对探测数据的影响降到最低;
- 然后结合所用背景场数据,进行融合前的背景场差异检查,剔除差异明显超出部分的数据,最后梳理成待融合的高质量数据。
- 同时实现历史数据的检查,达到历史数据集制作要求。
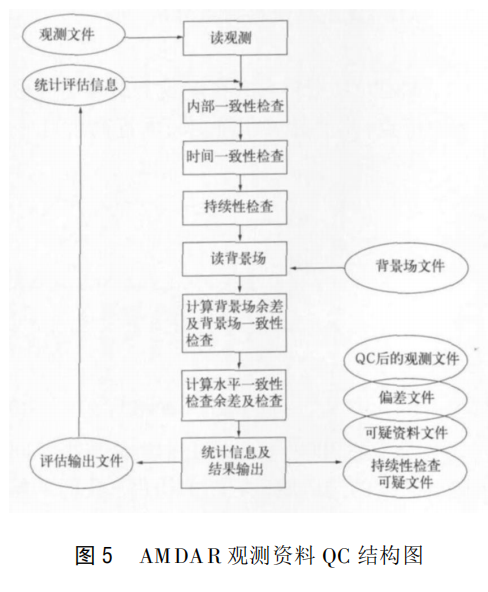
阅读:AMDAR 观测资料分析及质量控制

历史数据回算模块:(刘锦灿)
阅读:支持回算的大数据实时计算关键技术研究

阅读:基于多源高度计数据的海浪融合方法研究

2022-03-10 wjc老师反馈
孙沛东
风向的标准是什么?
0正北,90正东
风向转换?
以秒为单位
邓方宇
- 偏差订正
- 处理数据
- 模型算法
- 二维变分和三维变分的差别是什么?
- 三维变分,CCMP2.0
- CCMP 手册
- 三维变分…
- 变分同化…变分分析…
- 融合
刘锦灿
- …
- 改历史数据回算
2022-03-10 wjc老师反馈
洋面风偏差订正模块
辐射计精度相较于散射计差很多~
目标,10km~
缺失数据补,现场观测数据的校准~
U和V,U东西~
风向~
风速~
以正北方向为0度,顺时针表示,风向在已知U和V分量的情况下,风向的计算公式为:
tmp=270-arctan(v,u)*180/pi
alpha=mod(tmp,360)
UV融合模块
- 逐步订正
- 最优插值
- 二维变分
- 变分分析(CCMP)
历史回算模块
- 单点,多点,一段时间段,混合时间设置,在软件中的差异~~(刘锦灿)
海浪偏差订正
- 重新分成4个模块?
海浪模式构建
图,visio,(刘锦灿)
visio,连接符,
海浪数据同化模块
- 流依赖,
- 数据接入与标准化,
- 分水岭算法,(刘锦灿)
- 海浪谱分割策略,
海浪模式产品后处理模块
- ;
海浪融合模块
- 多尺度三维变分,何中杰老师;
2022-03-10 wjc老师反馈
晚上
- 二位海浪谱一般表现为频率-方向谱的矩阵,分水岭将矩阵处理为图像,进而将图像当作大地测量学的…,集水盆,…
- 海浪谱分割,…
- CAFSTO,波谱仪,海浪谱,分水岭,分割,。hjshshjdhjssakdsadsaui,skdjskjksdjasjkdssjdskdksadsadkjdsakjdskkkkkkkkkkkkkkkkkkkkkkkkkkkkkkkkkkkkkkkkkkkssssssssssssssssssskkkkkkkkkkkkkkksallllllllllsdjsak., sd sd sss sdsd sdhg jhsds shd
- 集合最优插值,输入:集合数、误差分布规律、标准化的海浪预测数据、模式背景场,
- 沿轨的~~
- jkdsjd~~
- 顶不住了,12点回了宿舍,老师~~